

Development of scoring system for risk stratification in clinical medicine: a step-by-step tutorial
- PMID: 29201888
- PMCID: PMC5690964
- DOI: 10.21037/atm.2017.08.22
Development of scoring system for risk stratification in clinical medicine: a step-by-step tutorial
Abstract
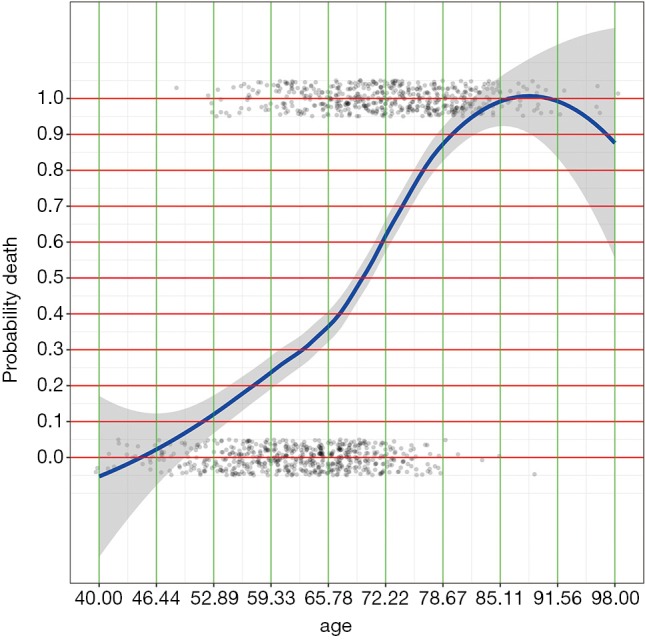
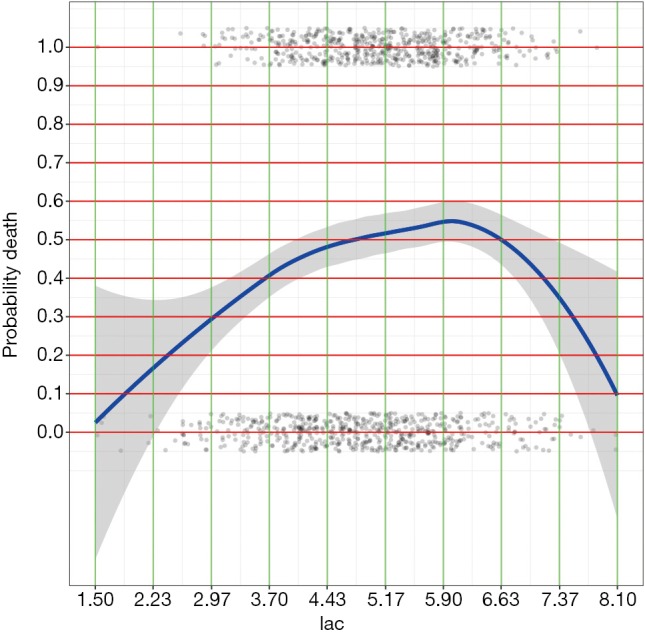
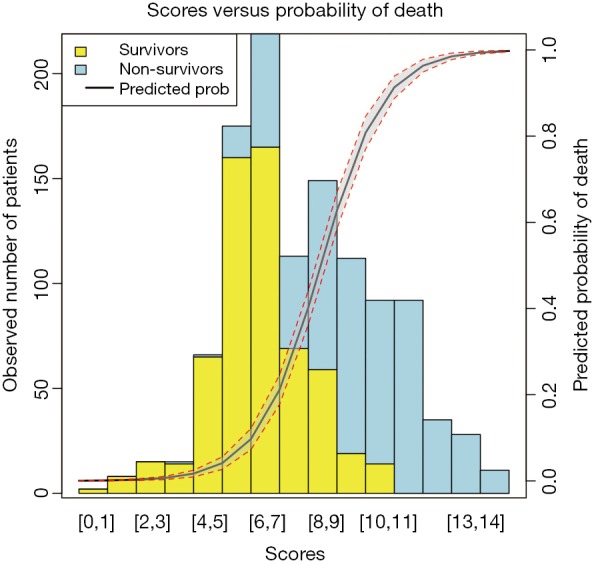
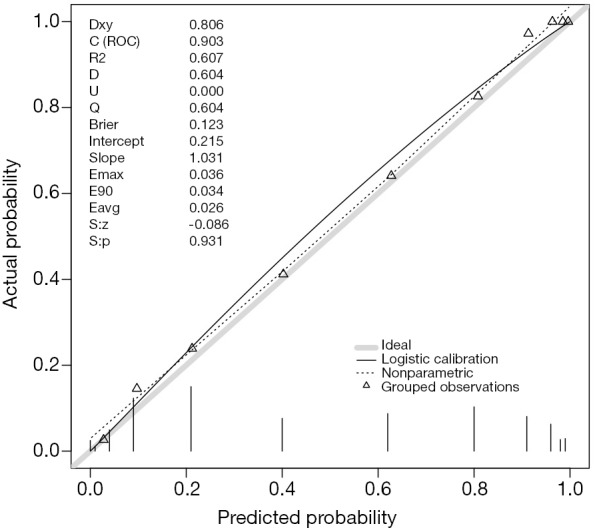
Risk scores play an important role in clinical medicine. With advances in information technology and availability of electronic healthcare record, scoring systems of less commonly seen diseases and population can be developed. The aim of the article is to provide a tutorial on how to develop and validate risk scores based on a virtual dataset by using R software. The dataset we generated including numeric and categorical variables and firstly the numeric variables would be converted to factor variables according to cutoff points identified by the LOESS smoother. Then risk points of each variable, which are related to the coefficients in logistic regression, are assigned to each level of the converted factor variables and other categorical variables. Finally, the total score is calculated for each subject to represent the prediction of the outcome event probability. The original dataset is split into training and validation subsets. Discrimination and calibration are evaluated in the validation subset. R codes with explanations are presented in the main text.
Keywords: LOESS smoothing; Scoring system; risk stratification.
Conflict of interest statement
Conflicts of Interest: The authors have no conflicts of interest to declare.
Figures
References
Publication types
LinkOut - more resources
Full Text Sources
Other Literature Sources