. 2017 Nov 9;3(4):622-635.
doi: 10.1016/j.trci.2017.10.001. eCollection 2017 Nov.

A randomized, exploratory molecular imaging study targeting amyloid β with a novel 8-OH quinoline in Alzheimer's disease: The PBT2-204 IMAGINE study

Affiliations

A randomized, exploratory molecular imaging study targeting amyloid β with a novel 8-OH quinoline in Alzheimer's disease: The PBT2-204 IMAGINE study

Victor L Villemagne et al. Alzheimers Dement (N Y). .

Abstract

Introduction: We are developing a second generation 8-OH quinoline (2-(dimethylamino) methyl-5, 7-dichloro-8-hydroxyquinoline [PBT2, Prana Biotechnology]) for targeting amyloid β (Aβ) in Alzheimer's disease (AD). In an earlier phase IIa, 3 month trial, PBT2 lowered cerebrospinal fluid Aβ by 13% and improved cognition (executive function) in a dose-related fashion in early AD. We, therefore, sought to learn whether PBT2 could alter the Aβ-PET signal in subjects with prodromal or mild AD, in an exploratory randomized study over a 12-month phase in a double-blind and a 12-month open label extension phase trial design.

Methods: For inclusion, the usual clinical criteria for prodromal or probable AD, Mini-Mental State Examination ≥20, and global Pittsburgh compound B (PiB)-PET standardized uptake volume ratio (SUVR) >1.7 were used. As this was an exploratory study, we included contemporaneous matched control data from the Australian Imaging Biomarker and Lifestyle Study (AIBL). Other measures included fluorodeoxyglucose-positron emission tomography, magnetic resonance imaging volumetrics, blood Aβ biomarkers, and cognition and function.

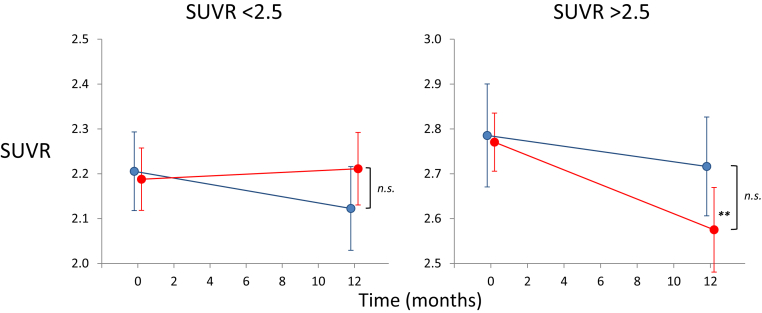
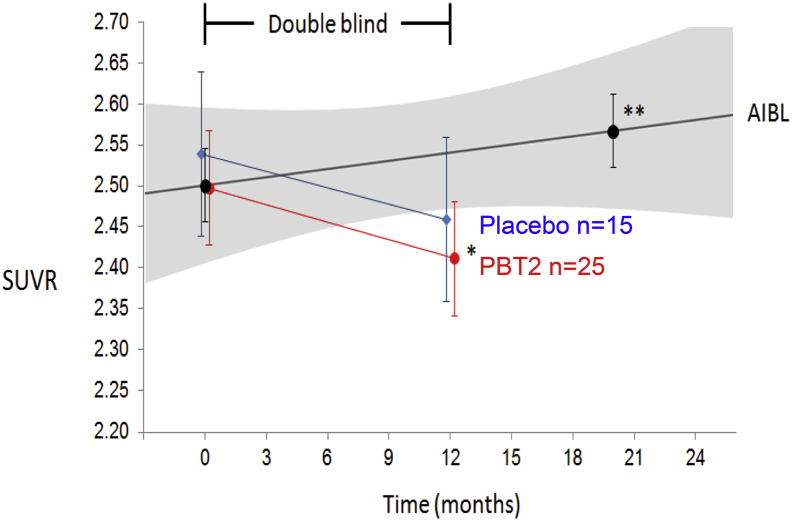
Results: Forty subjects completed the first 12-month double-blind phase (placebo = 15, PBT2 = 25), and 27 subjects completed the 12-month open label extension phase (placebo = 11, PBT2 = 16). Overall, PTB2 250 mg/day was safe and well tolerated. The mean PiB-PET SUVR at baseline was 2.51 ± 0.59. After adjusting for baseline SUVR, in the double-blind phase, the placebo group showed a nonsignificant decline in PiB-PET SUVR, whereas the PBT2 group declined significantly (P = .048). Subjects who did not enter or complete the extension study had a significantly higher 12-month Aβ-PET SUVR (2.68 ± 0.55) compared with those who completed (2.29 ± 0.48). Both groups differed significantly from the rate of change over 12 months in the AIBL control group. In the open label 12-month extension study, the PiB-SUVR stabilized. There were no significant differences between PBT2 and controls in fluorodeoxyglucose-positron emission tomography, magnetic resonance imaging volumetrics, blood Aβ biomarkers, or cognition/function over the course of the double-blind phase.

Discussion: There was no significant difference between PBT2 and controls at 12 months, likely due to the large individual variances over a relatively small number of subjects. PBT2 was associated with a significant 3% PiB-PET SUVR decline in the double-blind phase and a stabilization of SUVR in the open-label phase. From this exploratory study, we have learned that the entry criterion of SUVR should have been set at ≥ 1.5 and <2.0, where we know from the AIBL study that subjects in this band are accumulating Aβ in a linear fashion and that subjects who withdrew from this type of study have much higher SUVRs, which if not taken into account, could distort the final results. Because of large individual variations in SUVR, future studies of PBT2 will require larger numbers of subjects (n > 90 per arm) over a longer period (18 months or more). Further evaluation of higher doses of PBT2 in earlier stages of AD is warranted.

Trial registration: ACTRN 12611001008910 and ACTRN 12613000777796.

Keywords: Alzheimer's disease; Aβ-amyloid PET molecular imaging; Biomarkers for Alzheimer's disease; Clinical trial design; Novel 8-OH quinoline; Randomised control trial.


Figures

Fig. 1
Fig. 1
Schedule of investigations and assessments. Abbreviations: Aβ, amyloid β; FDG-PET, fluorodeoxyglucose-positron emission tomography, MRI, magnetic resonance imaging.
Fig. 2
Fig. 2
Flow diagram for the IMAGINE study (PBT2-204).
Fig. 3
Fig. 3
Longitudinal PiB data by placebo or active group. Line graphs of individual neocortical PiB SUVR in the different groups, over the double blind (0–12 months) and open label (12–24 months) phases of the study. Placebo group in blue; PBT2 group in red. Dotted line indicates the SUVR threshold of 1.7 used as inclusion criteria. Abbreviation: SUVR, standardized uptake volume ratio.
Fig. 4
Fig. 4
Relationship between the change (Δ) in PiB SUVR and baseline PiB SUVR in the different groups, over the double-blind (0–12 months) phase of the study. While there was a significant correlation between change in PiB SUVR and baseline PiB SUVR in the PBT2 group, this was not observed in the placebo group. Placebo group in blue; PBT2 group in red. Filled symbol denotes APOE ε4 carriers, while open symbol denotes APOE ε4 noncarriers. Abbreviation: SUVR, standardized uptake volume ratio.
Fig. 5
Fig. 5
Longitudinal PiB data by baseline PiB SUVR. Line graphs showing the mean (±SEM) PiB SUVR at baseline and at 12 months for the placebo (in blue) and PBT2 (in red) groups, in those participants with an adjusted baseline PiB SUVR of either <2.5 (left) or >2.5 (right). While there were no significant differences between placebo and PBT2 in either group, there was a significant decrease from baseline in the >2.5 PiB SUVR PBT2 group (P = .0023). Abbreviation: SUVR, standardized uptake volume ratio; n.s., not significant. ∗∗ P < .001.
Fig. 6
Fig. 6
Longitudinal PiB SUVR data from the IMAGINE double-blind phase. Line graphs showing the mean (±SEM) PiB SUVR at baseline and at 12 months for the placebo (blue circles) and PBT2 (red circles) groups. As a contemporaneous control group, a group of 46 AIBL participants (black circles) meeting the IMAGINE inclusion criteria and matched for IMAGINE baseline PiB SUVR. While there were no significant differences between placebo and PBT2 at 12 months, there was a significant decrease of 0.09 PiB SUVR/yr in the PBT2 group (P = .048). While the IMAGINE placebo group showed a nonsignificant decrease of 0.08 PiB SUVR/yr, the AIBL participants showed a significant increase of 0.04 PiB SUVR/yr (P = .0014), and an even greater increase (0.07 PiB SUVR/yr) was observed in the APOE ε4 placebo group of the bapineuzumab trial . Abbreviations: AIBL, Australian Imaging Biomarker and Lifestyle Study; SUVR, standardized uptake volume ratio. ∗∗P < .001.
Fig. 7
Fig. 7
Longitudinal PiB SUVR data from participants who completed the two phases of the IMAGINE study. Line graphs showing the mean (±SEM) PiB SUVR at baseline and at 12 months for 11 placebo (blue circles) and 16 PBT2 (red circles) participants in the IMAGINE double-blind phase of the study. In purple triangles, the 27 participants who completed the open label extension study. As comparison group, a group of 40 AIBL participants (black squares) meeting the IMAGINE inclusion criteria and matched for the baseline PiB SUVR of the 27 participants who completed the two phases of the IMAGINE study. While there were no significant differences between the 11 placebo and 16 PBT2 participants at 12 months, there was a significant decrease of 0.14 PiB SUVR/yr in the PBT2 group (P = .005). While the 11 IMAGINE placebo participants showed a nonsignificant decrease of 0.07 PiB SUVR/yr, the AIBL participants showed a significant increase of 0.04 PiB SUVR/yr (P = .0014). While no significant changes in PiB SUVR from 12 to 24 months were observed on the 27 participants who completed the IMAGINE open-label phase, a significant decrease of 0.04 PiB SUVR/yr (P = .05) was observed when changes in PiB SUVR from 0 to 24 months were considered. Abbreviations: AIBL, Australian Imaging Biomarker and Lifestyle Study; SUVR, standardized uptake volume ratio. ∗P < .05; ∗∗P < .001.
Fig. 8
Fig. 8
Comparison of the IMAGINE study PiB results with the reported PiB results of the bapineuzumab trial , , and the florbetapir results from the aducanumab trial . To allow comparison between the different Aβ tracers, florbetapir SUVRWCb are expressed in PiBCb-like units called BeCKeTs . A striking difference between the IMAGINE and the bapineuzumab and aducanumab trials is the Aβ burden at baseline. Overall, IMAGINE participants not only had significantly higher baseline Aβ burden, these baseline values were at levels for which we have demonstrated the rates of Aβ accumulation slow , making it difficult to discriminate between a potential drug effect that slows Aβ accumulation and the natural slowing that occurs at those SUVR levels. These comparisons highlight the importance of not only establishing a SUVR floor, but also the need of establishing a SUVR ceiling to ensure all participants are accumulating Aβ at a similar rate. Abbreviations: AIBL, Australian Imaging Biomarker and Lifestyle Study; SUVR, standardized uptake volume ratio. ∗ P < .05; ∗∗ P < .001.

References

    1. Sperling R.A., Aisen P.S., Beckett L.A., Bennett D.A., Craft S., Fagan A.M. Toward defining the preclinical stages of Alzheimer's disease: Recommendations from the National Institute on Aging and the Alzheimer's Association workgroup. Alzheimers Dement. 2011;7:280–292. - PMC - PubMed
    1. Dubois B., Feldman H.H., Jacova C., Hampel H., Molinuevo J.L., Blennow K. Advancing research diagnostic criteria for Alzheimer's disease: the IWG-2 criteria. Lancet Neurol. 2014;13:614–629. - PubMed
    1. Blennow K., Mattsson N., Scholl M., Hansson O., Zetterberg H. Amyloid biomarkers in Alzheimer's disease. Trends Pharmacol Sci. 2015;36:297–309. - PubMed
    1. Clark C.M., Pontecorvo M.J., Beach T.G., Bedell B.J., Coleman R.E., Doraiswamy P.M. Cerebral PET with florbetapir compared with neuropathology at autopsy for detection of neuritic amyloid-β plaques: a prospective cohort study. Lancet Neurol. 2012;11:669–678. - PubMed
    1. Matveev S.V., Spielmann H.P., Metts B.M., Chen J., Onono F., Zhu H. A distinct subfraction of Aβ is responsible for the high-affinity Pittsburgh compound B-binding site in Alzheimer's disease brain. J Neurochem. 2014;131:356–368. - PMC - PubMed