. 2017 Oct 31;2(10):6916-6925.
doi: 10.1021/acsomega.7b01134. Epub 2017 Oct 19.

Dihydrosanguinarine Enhances Glucose Uptake in Mouse 3T3-L1 Cells

Affiliations

Dihydrosanguinarine Enhances Glucose Uptake in Mouse 3T3-L1 Cells

Yit-Lai Chow et al. ACS Omega. .

Abstract

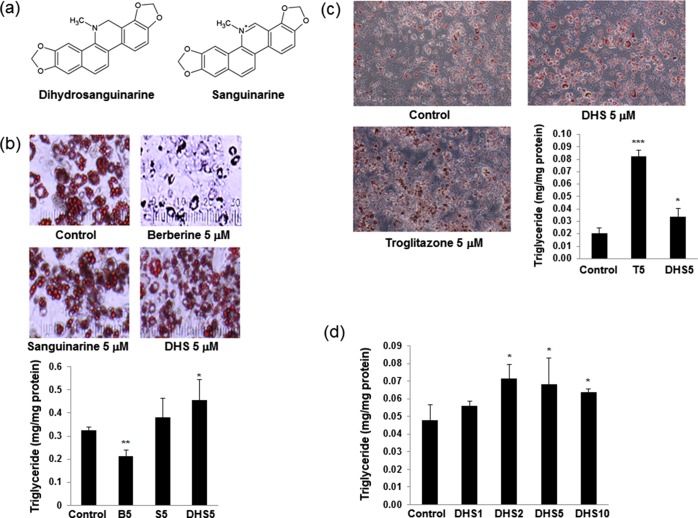
Recently, more studies have aimed at identifying selective peroxisome proliferator-activated receptor gamma (PPARγ) modulators that transactivate the expression of PPARγ-dependent genes as partial agonists to improve diabetic symptoms with fewer side effects compared to classic PPARγ agonists such as thiazolidinediones. We found that dihydrosanguinarine (DHS) treatment induced preadipocyte differentiation and lipid droplet accumulation in 3T3-L1 cells, but this effect is weaker than that elicited by the full PPARγ agonist troglitazone. Furthermore, this effect was reduced by the addition of a PPARγ antagonist, indicating the involvement of PPARγ signaling. Our results suggest that the stimulatory effects of DHS on adipocyte differentiation and insulin sensitivity are mediated by suppressing adenosine monophosphate-activated protein kinase (AMPK) alpha, upregulating the expression of PPARγ and its target genes (particularly Glut-4 and adiponectin) and reducing PPARγ phosphorylation. DHS significantly enhanced the glucose uptake in 3T3-L1 adipocytes without observable cytotoxicity at the effective concentration (5 μM) applied.


Conflict of interest statement

The authors declare no competing financial interest.

Figures

Figure 1
Figure 1
(a) Molecular structures of dihydrosanguinarine (DHS) and sanguinarine. (b) Oil Red O stain of 3T3-L1 adipocytes and the triglyceride content in 3T3-L1 adipocytes at day 12 and (c) day 8. All compounds were tested at 5 μM [containing 0.1% dimethyl sulfoxide (DMSO)]. n = 9 from three independent experiments. (d) Triglyceride content in 3T3-L1 adipocytes at day 8 after treatment with various concentrations of DHS. n = 3; error bar = standard deviation (SD). *p < 0.05, **p < 0.005, ***p < 0.001 vs control; two-tailed Student’s t-test.
Figure 2
Figure 2
Quantitative RT-PCR of adipogenesis-related pathway genes. 3T3-L1 preadipocytes were treated with 5 μM troglitazone (T), berberine (B), or DHS (D) for 5 days. n = 3 from three independent experiments; error bar = SD. *p < 0.05, **p < 0.005, ***p < 0.001 vs control; two-tailed Student’s t-test.
Figure 3
Figure 3
(a) Oil Red O staining of 3T3-L1 adipocytes and triglyceride content in 3T3-L1 adipocytes at day 8. n = 3; error bar = SD. *p < 0.05, ***p < 0.001; a—compared to control, b—compared to G10 [analysis of variance (ANOVA) followed by Dunnett’s multiple comparisons test]. (b) Quantitative RT-PCR of adipogenic genes in 3T3-L1 preadipocytes treated with 5 μM DHS (D5) or 10 μM GW9662 and 5 μM DHS (G10 + D5) for 5 days. n = 3; error bar = SD. *p < 0.05, **p < 0.005 compared to respective control; two-tailed Student’s t-test. (c) Immunoblotting analyses of 3T3-L1 preadipocytes treated with 5 μM DHS (D5), 10 μM GW9662, and 5 μM DHS (GD), or 5 μM troglitazone (T5) for 5 days. n = 3; error bar = SD. *p < 0.05, ***p < 0.001; a—compared to control, b—compared to D5 (ANOVA followed by Dunnett’s multiple comparisons test).
Figure 4
Figure 4
(a) Binding ability of DHS to PPAR in a nuclear receptor cofactor assay. GW1929 was used as a positive control. This experiment was performed in duplicate, and the average values are shown. (b) Transactivation activity of the PPARγ-derived reporter gene in HepG2 cells after treatment with troglitazone (T) and DHS (D) in μM. Relative luciferase activities were normalized to β-galactosidase activity. n = 3; error bar = SD. **p < 0.01 vs control, two-tailed Student’s t-test. (c) PPARγ transactivation activity in 3T3-L1 cells. The average values were shown (n = 3). The results were normalized to control (0.1% DMSO).
Figure 5
Figure 5
Immunoblotting analyses of 3T3-L1 preadipocytes treated with (a) 2, 5, or 10 μM DHS for 24 h; (b) 5 μM troglitazone or 5 μM DHS for 5 days. D—DHS, T—troglitazone. n = 6, error bar = SD. *p < 0.05 vs control; two-tailed Student’s t-test.
Figure 6
Figure 6
Immunoblotting analyses of 3T3-L1 preadipocytes treated with (a) 5 μM troglitazone (T), berberine (B), or DHS (D) for 5 days. (b) 2, 5, or 10 μM DHS for 24 h. n = 3 from three independent experiments; error bar = SD. *p < 0.05 vs control; two-tailed Student’s t-test. (c) Glucose uptake effect of troglitazone (T), berberine (B), and DHS (D). Adipocytes were treated with 5 μM troglitazone, 5 μM berberine, or 5 or 10 μM DHS. The values are normalized to the protein content of each sample. n = 3 from three independent experiments; error bar = SD. *p < 0.05 vs control; two-tailed Student’s t-test.
Figure 7
Figure 7
(a) Accumulation of DHS and sanguinarine in cells and in the cell culture medium after 48 h treatment with the respective compound. n = 3 from two independent experiments; error bar = SD. (b) 3T3-L1 adipocyte viability after 24 h treatment with DHS at various concentrations. n = 5 from three independent experiments; error bar = SD. *p < 0.05, **p < 0.005 vs control; two-tailed Student’s t-test.

Similar articles

Cited by

References

    1. Jessen B. A.; Stevens G. J. Expression profiling during adipocyte differentiation of 3T3-L1 fibroblasts. Gene 2002, 299, 95–100. 10.1016/s0378-1119(02)01017-x. - DOI - PubMed
    1. Evans R. M.; Barish G. D.; Wang Y.-X. PPARs and the complex journey to obesity. Nat. Med. 2004, 4, 355–361. 10.1038/nm1025. - DOI - PubMed
    1. Tontonoz P.; Spiegelman B. M. Fat and beyond: the diverse biology of PPARγ. Annu. Rev. Biochem. 2008, 77, 289–312. 10.1146/annurev.biochem.77.061307.091829. - DOI - PubMed
    1. Wu Z.; Rosen E. D.; Brun R.; Hauser S.; Adelmant G.; Troy A. E.; McKeon C.; Darlington G. J.; Spiegelman B. M. Cross-regulation of C/EBPα and PPARγ controls the transcriptional pathway of adipogenesis and insulin sensitivity. Mol. Cell 1999, 3, 151–158. 10.1016/s1097-2765(00)80306-8. - DOI - PubMed
    1. Rosen E. D.; Hsu C.-H.; Wang X.; Sakai S.; Freeman M. W.; Gonzalez F. J.; Spiegelman B. M. C/EBPα induces adipogenesis through PPARγ: a unified pathway. Genes Dev. 2002, 16, 22–26. 10.1101/gad.948702. - DOI - PMC - PubMed