

Targeted nanocomplex carrying siRNA against MALAT1 sensitizes glioblastoma to temozolomide
- PMID: 29202181
- PMCID: PMC5815062
- DOI: 10.1093/nar/gkx1221
Targeted nanocomplex carrying siRNA against MALAT1 sensitizes glioblastoma to temozolomide
Abstract
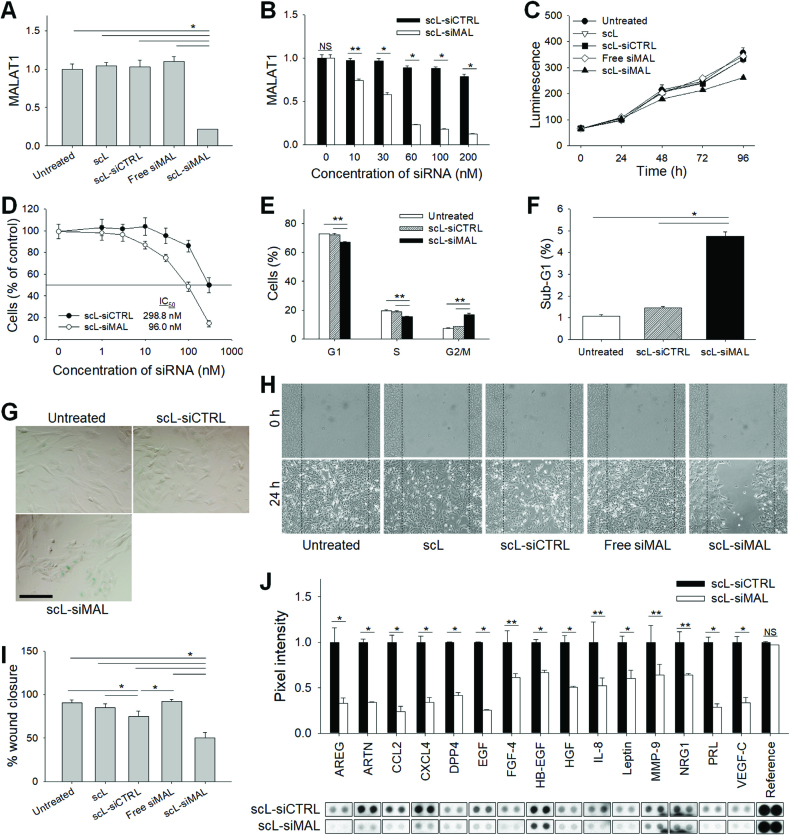
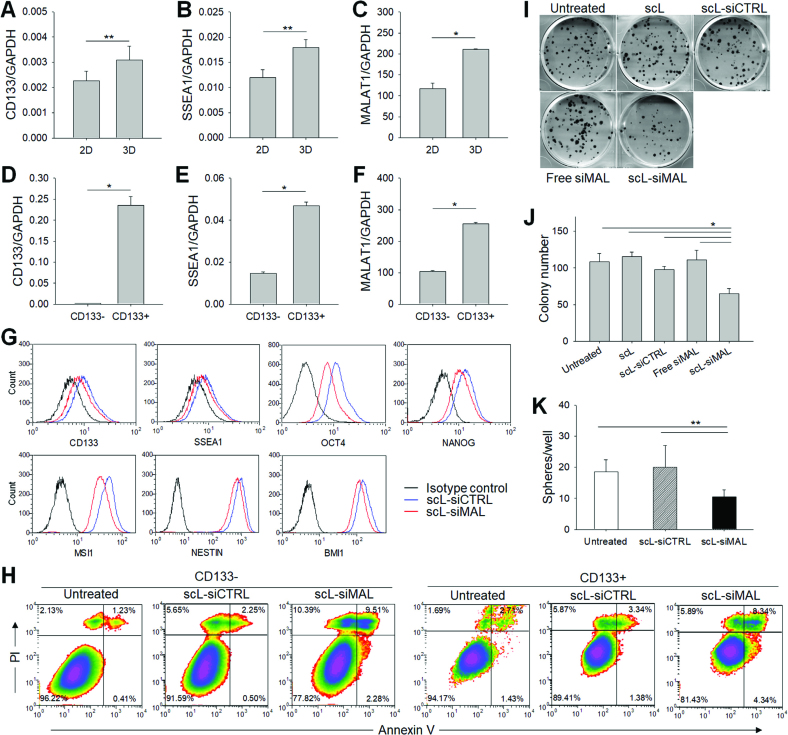
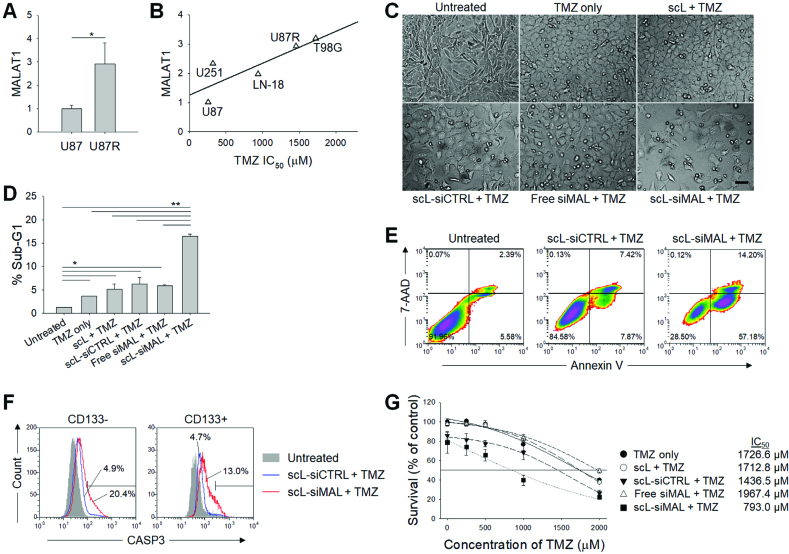
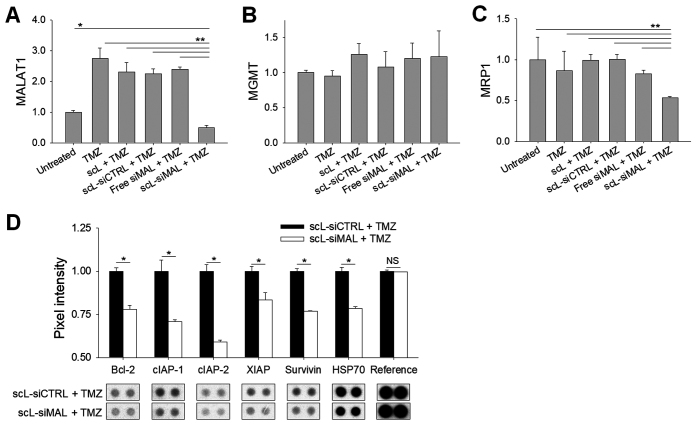
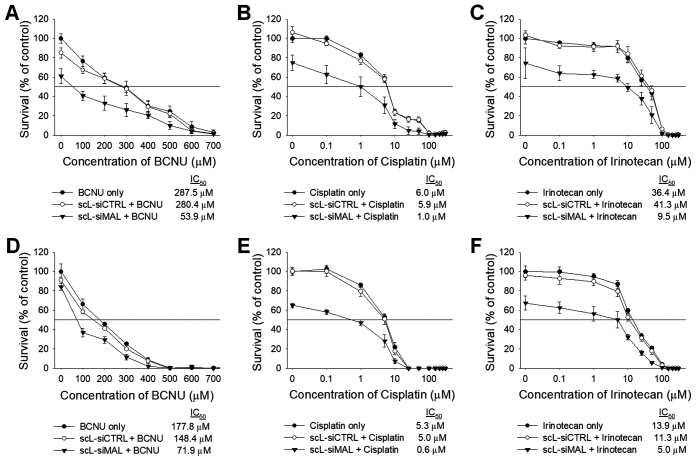
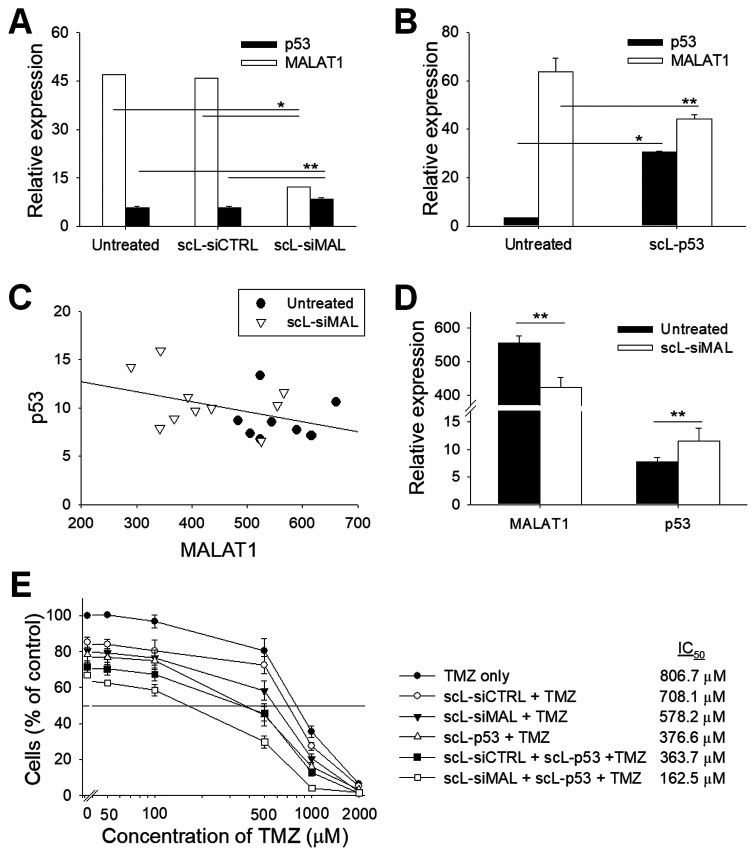
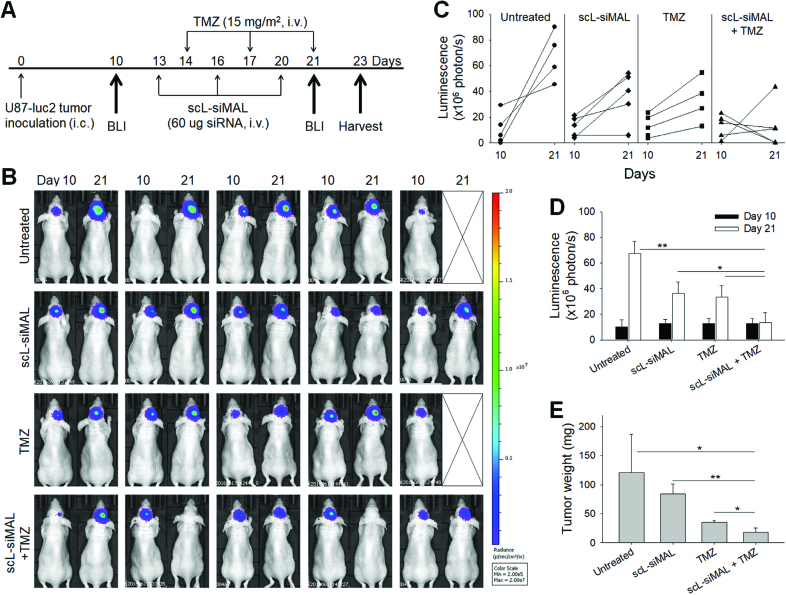
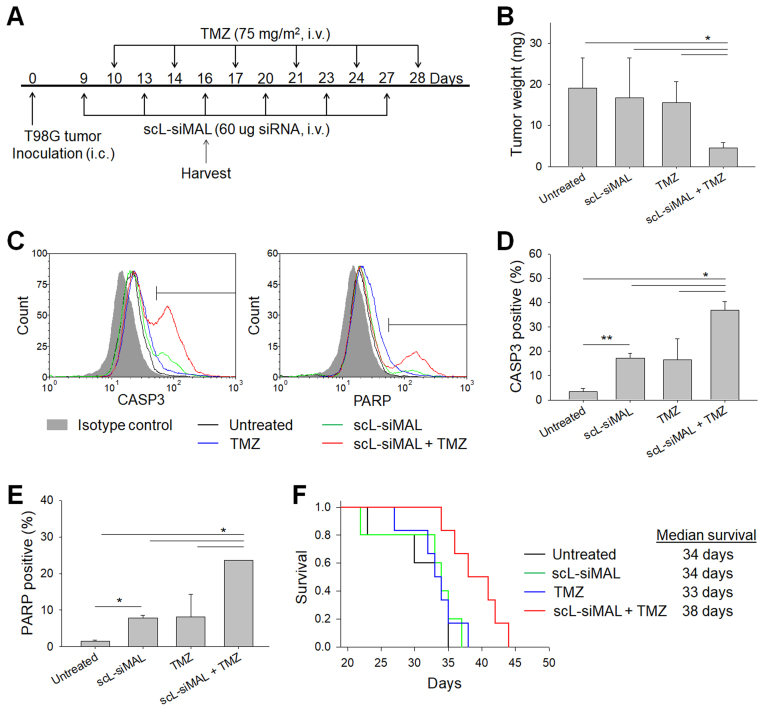
Intrinsic therapeutic resistance especially in cancer stem cells (CSCs) together with extensive tumor cell infiltration and restricted permeation of the blood-brain barrier (BBB) by drugs may all contribute to the treatment failure in patients with glioblastoma multiforme (GBM). Accumulating evidence suggests that long non-coding RNA (lncRNA), metastasis-associated lung adenocarcinoma transcript 1 (MALAT1) plays a role in tumor cell infiltration and therapeutic resistance of GBM. Using our tumor-targeted nanocomplex, we have modulated the expression of MALAT1 and investigated its impact on GBM cells. Importantly, our nanocomplex is able to target CSCs that are considered to be the prime culprits in therapeutic resistance and recurrence of GBM. Attenuation of MALAT1 by RNA interference significantly lowered the growth, motility and stemness of GBM cells. In addition, silencing of MALAT1 clearly improved the sensitivity of GBM cells to chemotherapeutic agents including the current first-line therapy of GBM [temozolomide (TMZ)]. In animal models of GBM, tumor involution with a modest but statistically significant survival benefit was achieved with concurrent treatment of TMZ and nanocomplex-mediated silencing of MALAT1. These results suggest that combining standard TMZ treatment with lncRNA-targeting therapies using our nanocomplex could substantially enhance the very poor prognosis for GBM patients.
Figures
Similar articles
-
MALAT1 is a prognostic factor in glioblastoma multiforme and induces chemoresistance to temozolomide through suppressing miR-203 and promoting thymidylate synthase expression.Oncotarget. 2017 Apr 4;8(14):22783-22799. doi: 10.18632/oncotarget.15199. Oncotarget. 2017. PMID: 28187000 Free PMC article.
-
Lnc-TALC promotes O6-methylguanine-DNA methyltransferase expression via regulating the c-Met pathway by competitively binding with miR-20b-3p.Nat Commun. 2019 May 3;10(1):2045. doi: 10.1038/s41467-019-10025-2. Nat Commun. 2019. PMID: 31053733 Free PMC article.
-
Long Non-Coding RNA MALAT1 Decreases the Sensitivity of Resistant Glioblastoma Cell Lines to Temozolomide.Cell Physiol Biochem. 2017;42(3):1192-1201. doi: 10.1159/000478917. Epub 2017 Jul 3. Cell Physiol Biochem. 2017. PMID: 28668966
-
Involvement of Intracellular Cholesterol in Temozolomide-Induced Glioblastoma Cell Death.Neurol Med Chir (Tokyo). 2018 Jul 15;58(7):296-302. doi: 10.2176/nmc.ra.2018-0040. Epub 2018 Jun 13. Neurol Med Chir (Tokyo). 2018. PMID: 29899179 Free PMC article. Review.
-
Role of Non-coding RNAs in the Response of Glioblastoma to Temozolomide.Mol Neurobiol. 2025 Feb;62(2):1726-1755. doi: 10.1007/s12035-024-04316-z. Epub 2024 Jul 18. Mol Neurobiol. 2025. PMID: 39023794 Review.
Cited by
-
Reactive Oxygen Species and Long Non-Coding RNAs, an Unexpected Crossroad in Cancer Cells.Int J Mol Sci. 2022 Sep 4;23(17):10133. doi: 10.3390/ijms231710133. Int J Mol Sci. 2022. PMID: 36077530 Free PMC article. Review.
-
Multifunctional nanoplatforms based on RNA interference for glioma treatment.Am J Cancer Res. 2025 Mar 15;15(3):835-854. doi: 10.62347/AERM5603. eCollection 2025. Am J Cancer Res. 2025. PMID: 40226466 Free PMC article. Review.
-
Natural Food Components as Biocompatible Carriers: A Novel Approach to Glioblastoma Drug Delivery.Foods. 2024 Sep 4;13(17):2812. doi: 10.3390/foods13172812. Foods. 2024. PMID: 39272576 Free PMC article. Review.
-
Targeting and engineering long non-coding RNAs for cancer therapy.Nat Rev Genet. 2024 Aug;25(8):578-595. doi: 10.1038/s41576-024-00693-2. Epub 2024 Feb 29. Nat Rev Genet. 2024. PMID: 38424237 Review.
-
p53-regulated lncRNAs in cancers: from proliferation and metastasis to therapy.Cancer Gene Ther. 2023 Nov;30(11):1456-1470. doi: 10.1038/s41417-023-00662-7. Epub 2023 Sep 7. Cancer Gene Ther. 2023. PMID: 37679529 Review.
References
-
- Stupp R., Mason W.P., van den Bent M.J., Weller M., Fisher B., Taphoorn M.J., Belanger K., Brandes A.A., Marosi C., Bogdahn U. et al. . Radiotherapy plus concomitant and adjuvant temozolomide for glioblastoma. N. Engl. J. Med. 2005; 352:987–996. - PubMed
-
- Wen P.Y., Kesari S.. Malignant gliomas in adults. N. Engl. J. Med. 2008; 359:492–507. - PubMed
-
- Singh S.K., Hawkins C., Clarke I.D., Squire J.A., Bayani J., Hide T., Henkelman R.M., Cusimano M.D., Dirks P.B.. Identification of human brain tumour initiating cells. Nature. 2004; 432:396–401. - PubMed
Publication types
MeSH terms
Substances
Grants and funding
LinkOut - more resources
Full Text Sources
Other Literature Sources
Medical
