

3D-MICE: integration of cross-sectional and longitudinal imputation for multi-analyte longitudinal clinical data
- PMID: 29202205
- PMCID: PMC7646951
- DOI: 10.1093/jamia/ocx133
3D-MICE: integration of cross-sectional and longitudinal imputation for multi-analyte longitudinal clinical data
Abstract
Objective: A key challenge in clinical data mining is that most clinical datasets contain missing data. Since many commonly used machine learning algorithms require complete datasets (no missing data), clinical analytic approaches often entail an imputation procedure to "fill in" missing data. However, although most clinical datasets contain a temporal component, most commonly used imputation methods do not adequately accommodate longitudinal time-based data. We sought to develop a new imputation algorithm, 3-dimensional multiple imputation with chained equations (3D-MICE), that can perform accurate imputation of missing clinical time series data.
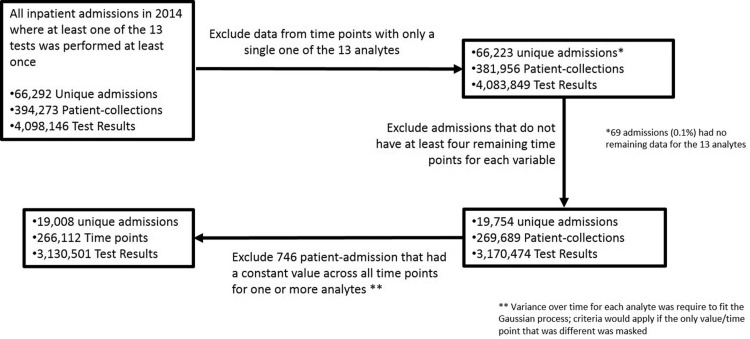
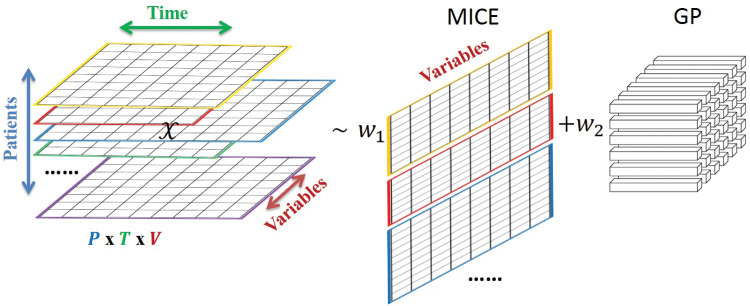
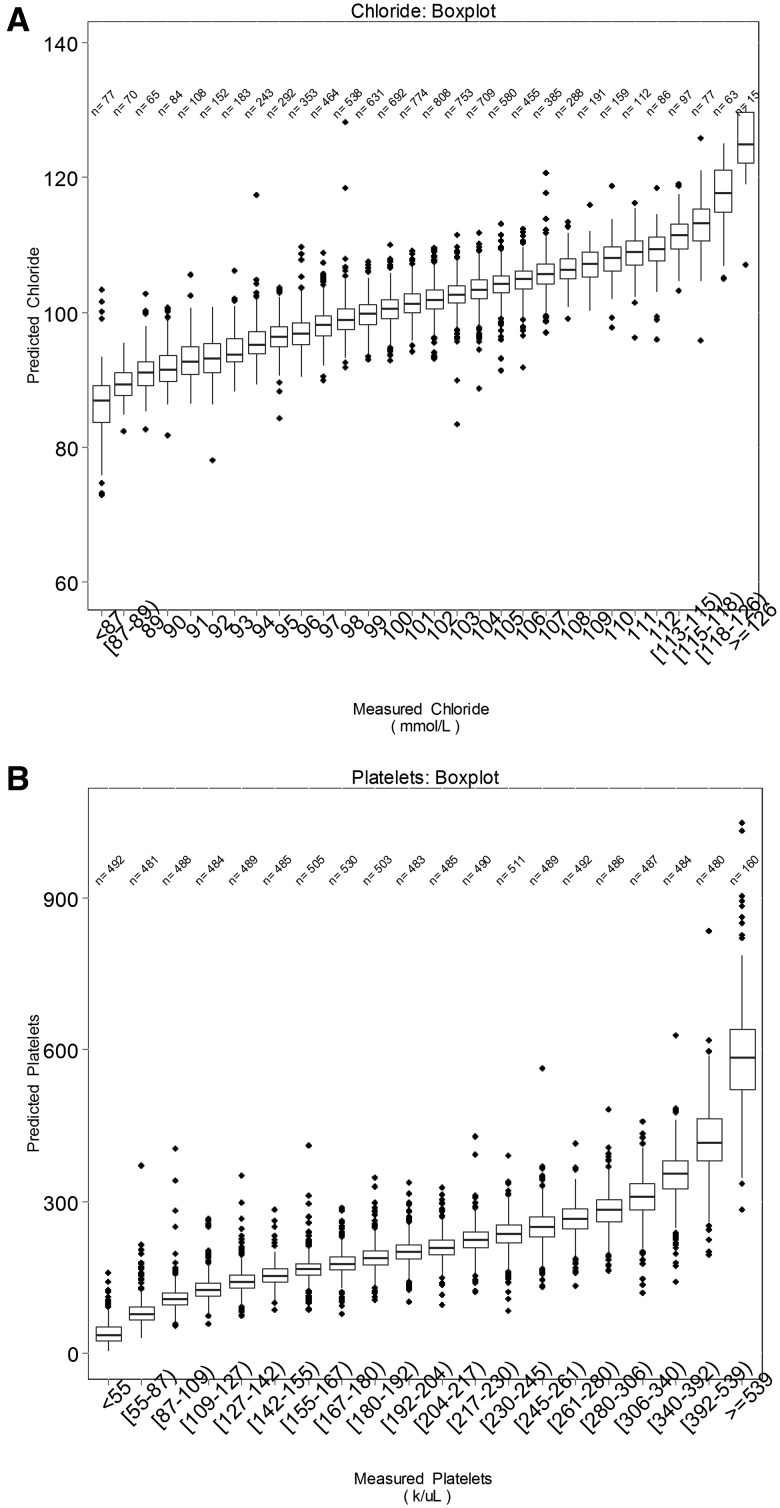
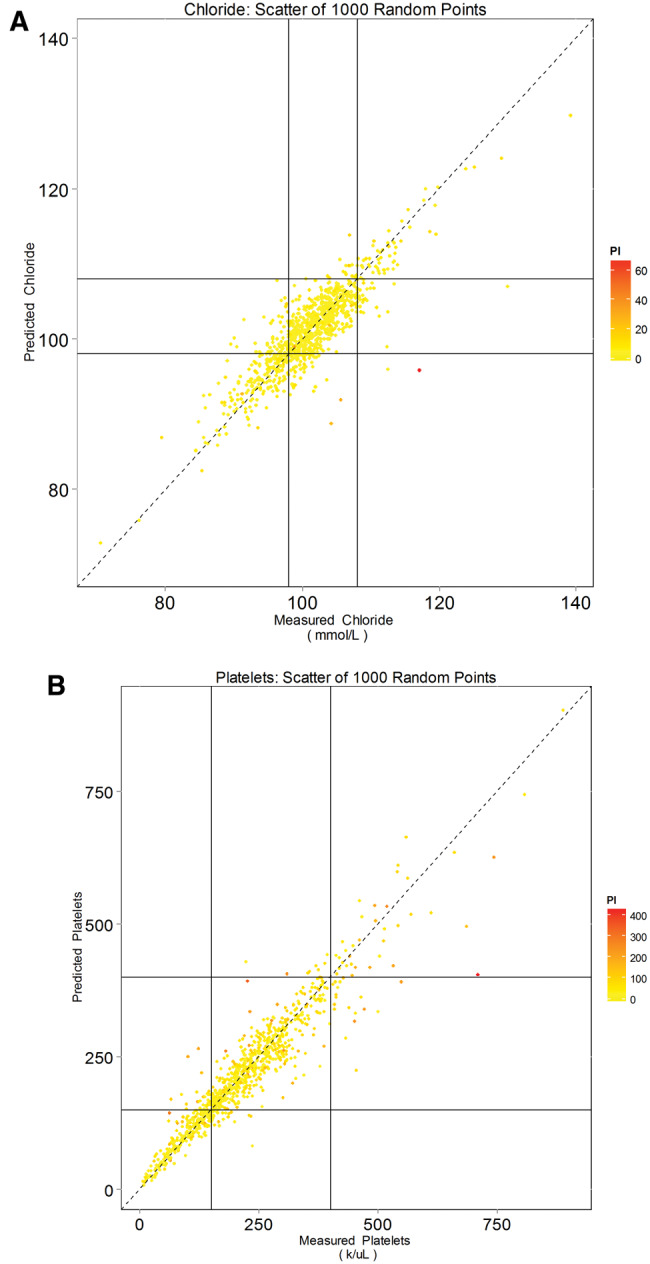
Methods: We extracted clinical laboratory test results for 13 commonly measured analytes (clinical laboratory tests). We imputed missing test results for the 13 analytes using 3 imputation methods: multiple imputation with chained equations (MICE), Gaussian process (GP), and 3D-MICE. 3D-MICE utilizes both MICE and GP imputation to integrate cross-sectional and longitudinal information. To evaluate imputation method performance, we randomly masked selected test results and imputed these masked results alongside results missing from our original data. We compared predicted results to measured results for masked data points.
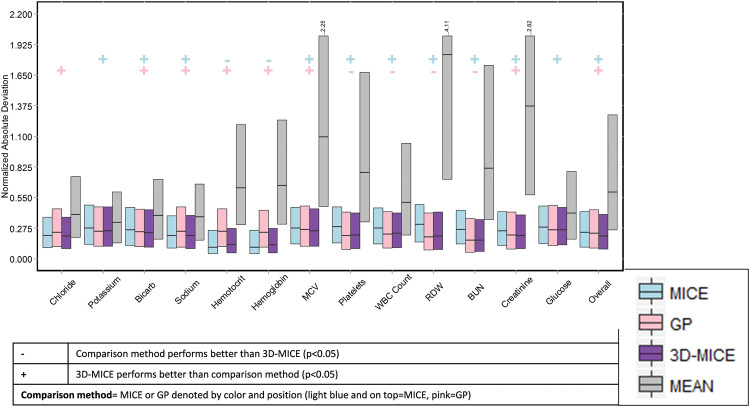
Results: 3D-MICE performed significantly better than MICE and GP-based imputation in a composite of all 13 analytes, predicting missing results with a normalized root-mean-square error of 0.342, compared to 0.373 for MICE alone and 0.358 for GP alone.
Conclusions: 3D-MICE offers a novel and practical approach to imputing clinical laboratory time series data. 3D-MICE may provide an additional tool for use as a foundation in clinical predictive analytics and intelligent clinical decision support.
Figures
Similar articles
-
Exploiting mutual information for the imputation of static and dynamic mixed-type clinical data with an adaptive k-nearest neighbours approach.BMC Med Inform Decis Mak. 2020 Aug 20;20(Suppl 5):174. doi: 10.1186/s12911-020-01166-2. BMC Med Inform Decis Mak. 2020. PMID: 32819346 Free PMC article.
-
A Combined Interpolation and Weighted K-Nearest Neighbours Approach for the Imputation of Longitudinal ICU Laboratory Data.J Healthc Inform Res. 2020 Mar 2;4(2):174-188. doi: 10.1007/s41666-020-00069-1. eCollection 2020 Jun. J Healthc Inform Res. 2020. PMID: 35415441 Free PMC article.
-
Evaluating the state of the art in missing data imputation for clinical data.Brief Bioinform. 2022 Jan 17;23(1):bbab489. doi: 10.1093/bib/bbab489. Brief Bioinform. 2022. PMID: 34882223 Free PMC article.
-
Computational Methods for Data Integration and Imputation of Missing Values in Omics Datasets.Proteomics. 2025 Jan;25(1-2):e202400100. doi: 10.1002/pmic.202400100. Epub 2024 Dec 30. Proteomics. 2025. PMID: 39740174
-
Moving Beyond Medical Statistics: A Systematic Review on Missing Data Handling in Electronic Health Records.Health Data Sci. 2024 Dec 4;4:0176. doi: 10.34133/hds.0176. eCollection 2024. Health Data Sci. 2024. PMID: 39635227 Free PMC article. Review.
Cited by
-
Imputation of Missing Data in Electronic Health Records Based on Patients' Similarities.J Healthc Inform Res. 2020 May 7;4(3):295-307. doi: 10.1007/s41666-020-00073-5. eCollection 2020 Sep. J Healthc Inform Res. 2020. PMID: 35415446 Free PMC article.
-
Missing Value Estimation using Clustering and Deep Learning within Multiple Imputation Framework.Knowl Based Syst. 2022 Aug 5;249:108968. doi: 10.1016/j.knosys.2022.108968. Epub 2022 May 10. Knowl Based Syst. 2022. PMID: 36159738 Free PMC article.
-
Exploiting mutual information for the imputation of static and dynamic mixed-type clinical data with an adaptive k-nearest neighbours approach.BMC Med Inform Decis Mak. 2020 Aug 20;20(Suppl 5):174. doi: 10.1186/s12911-020-01166-2. BMC Med Inform Decis Mak. 2020. PMID: 32819346 Free PMC article.
-
A Combined Interpolation and Weighted K-Nearest Neighbours Approach for the Imputation of Longitudinal ICU Laboratory Data.J Healthc Inform Res. 2020 Mar 2;4(2):174-188. doi: 10.1007/s41666-020-00069-1. eCollection 2020 Jun. J Healthc Inform Res. 2020. PMID: 35415441 Free PMC article.
-
Has the Flood Entered the Basement? A Systematic Literature Review about Machine Learning in Laboratory Medicine.Diagnostics (Basel). 2021 Feb 22;11(2):372. doi: 10.3390/diagnostics11020372. Diagnostics (Basel). 2021. PMID: 33671623 Free PMC article. Review.
References
Publication types
MeSH terms
LinkOut - more resources
Full Text Sources
Other Literature Sources
