

Effect of parameter selection on entropy calculation for long walking trials
- PMID: 29202357
- PMCID: PMC5809187
- DOI: 10.1016/j.gaitpost.2017.11.023
Effect of parameter selection on entropy calculation for long walking trials
Abstract
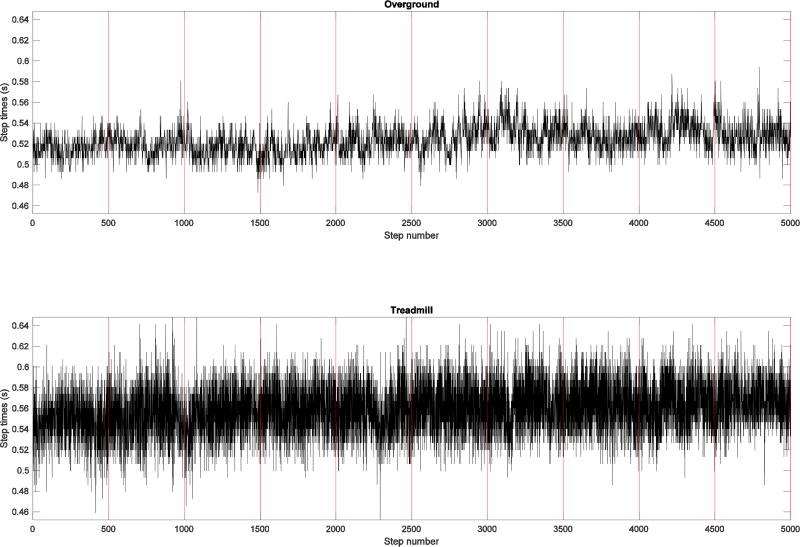
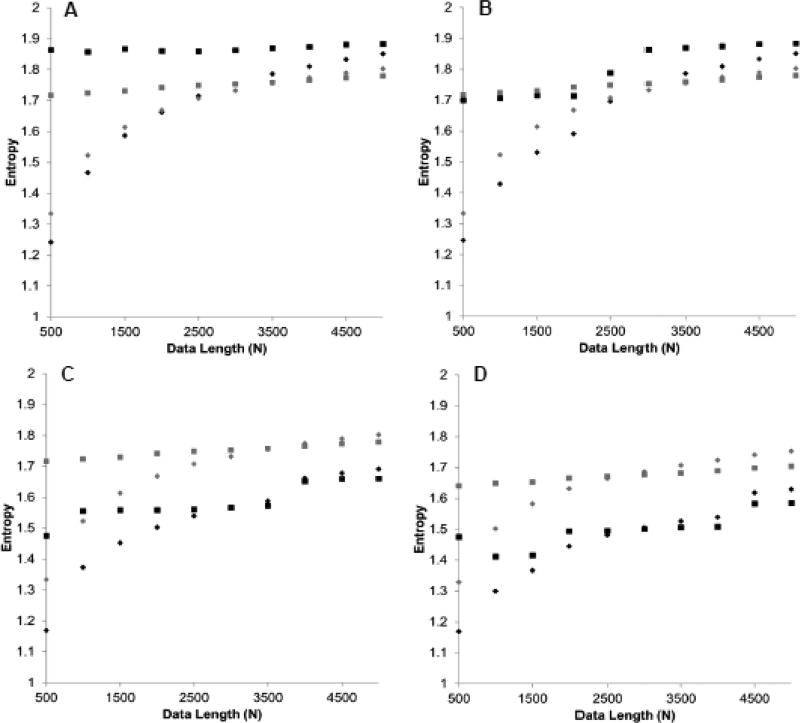
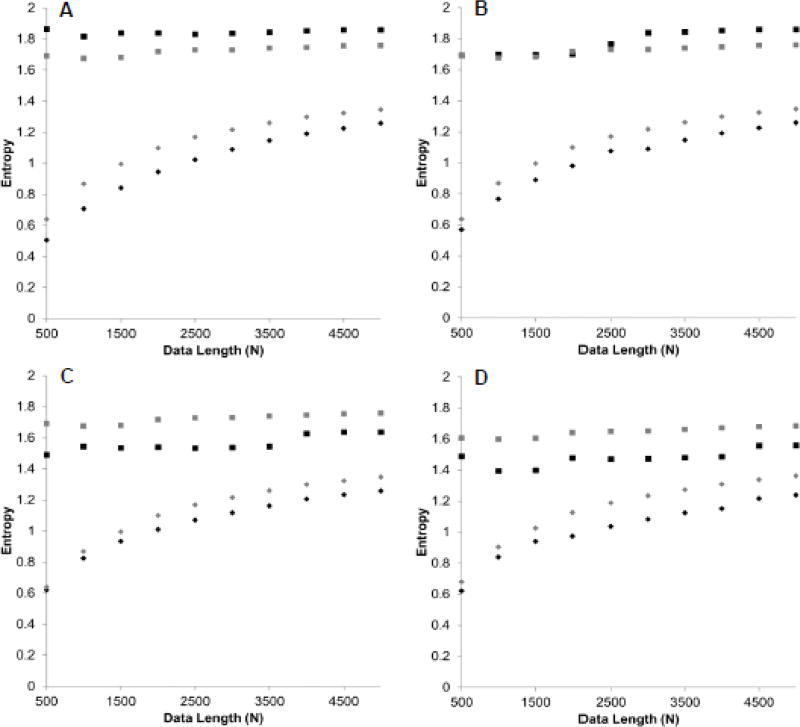
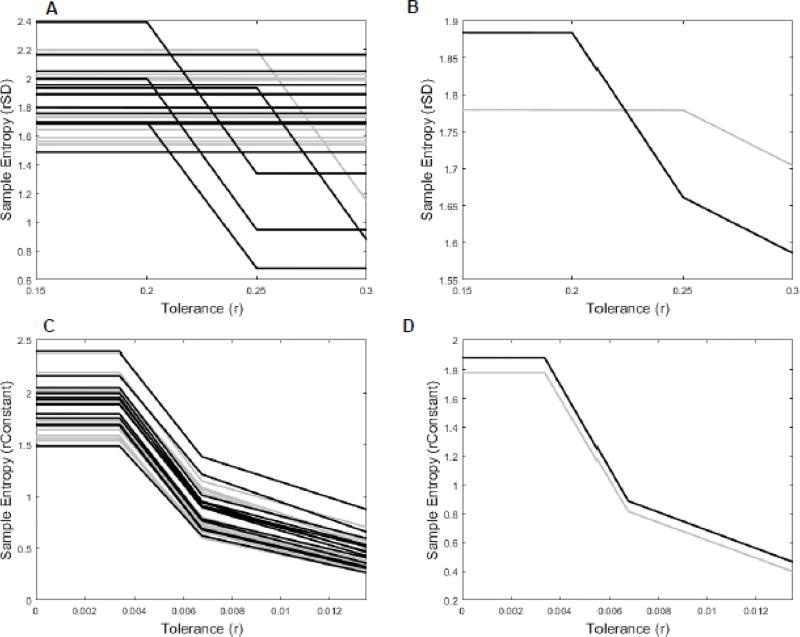
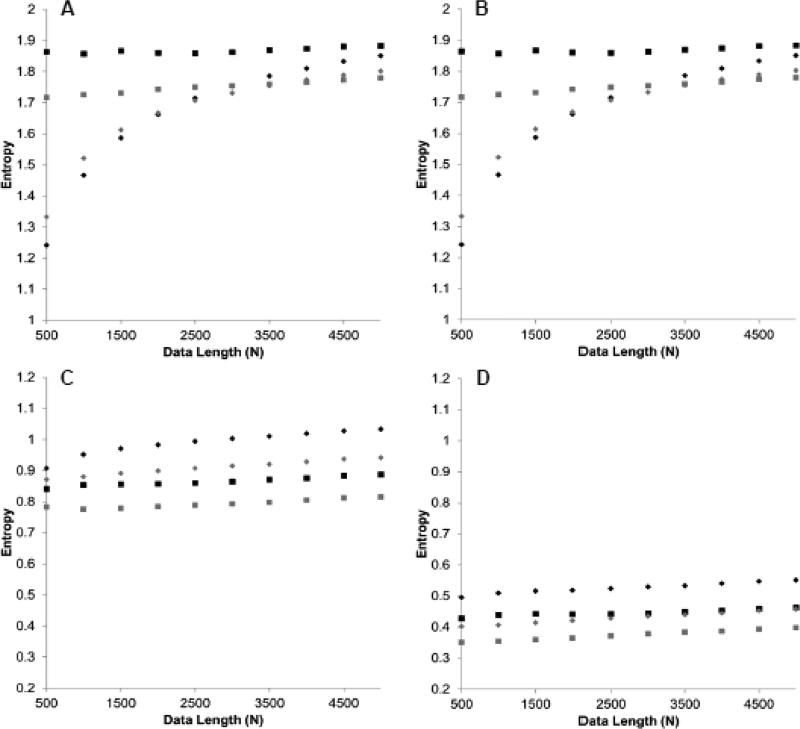
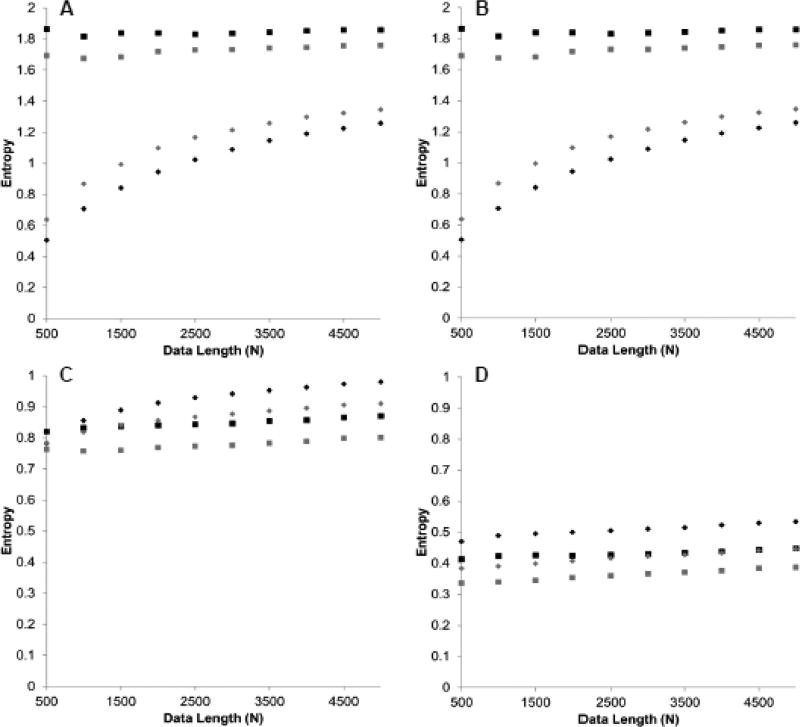
It is sometimes difficult to obtain uninterrupted data sets that are long enough to perform nonlinear analysis, especially in pathological populations. It is currently unclear as to how many data points are needed for reliable entropy analysis. The aims of this study were to determine the effect of changing parameter values of m, r, and N on entropy calculations for long gait data sets using two different modes of walking (i.e., overground versus treadmill). Fourteen young adults walked overground and on a treadmill at their preferred walking speed for one-hour while step time was collected via heel switches. Approximate (ApEn) and sample entropy (SampEn) were calculated using multiple parameter combinations of m, N, and r. Further, r was tested under two cases r*standard deviation and r constant. ApEn differed depending on the combination of r, m, and N. ApEn demonstrated relative consistency except when m=2 and the smallest r values used (rSD=0.015*SD, 0.20*SD; rConstant=0 and 0.003). For SampEn, as r increased, SampEn decreased. When r was constant, SampEn demonstrated excellent relative consistency for all combinations of r, m, and N. When r constant was used, overground walking was more regular than treadmill. However, treadmill walking was found to be more regular when using rSD for both ApEn and SampEn. For greatest relative consistency of step time data, it was best to use a constant r value and SampEn. When using entropy, several r values must be examined and reported to ensure that results are not an artifact of parameter choice.
Keywords: Complexity; Gait; Locomotion; Predictability; Regularity; Treadmill.
Copyright © 2017 Elsevier B.V. All rights reserved.
Conflict of interest statement
The authors have no conflicts of interest to disclose.
Figures
Similar articles
-
On the use of approximate entropy and sample entropy with centre of pressure time-series.J Neuroeng Rehabil. 2018 Dec 12;15(1):116. doi: 10.1186/s12984-018-0465-9. J Neuroeng Rehabil. 2018. PMID: 30541587 Free PMC article.
-
The appropriate use of approximate entropy and sample entropy with short data sets.Ann Biomed Eng. 2013 Feb;41(2):349-65. doi: 10.1007/s10439-012-0668-3. Epub 2012 Oct 12. Ann Biomed Eng. 2013. PMID: 23064819 Free PMC article.
-
Self-paced treadmills do not allow for valid observation of linear and nonlinear gait variability outcomes in patients with Parkinson's disease.Gait Posture. 2022 Jan;91:35-41. doi: 10.1016/j.gaitpost.2021.10.008. Epub 2021 Oct 7. Gait Posture. 2022. PMID: 34634614
-
The influence of walking speed and effects of signal processing methods on the level of human gait regularity during treadmill walking.BMC Sports Sci Med Rehabil. 2022 Dec 10;14(1):209. doi: 10.1186/s13102-022-00600-4. BMC Sports Sci Med Rehabil. 2022. PMID: 36496418 Free PMC article.
-
Entropy Analysis in Gait Research: Methodological Considerations and Recommendations.Ann Biomed Eng. 2021 Mar;49(3):979-990. doi: 10.1007/s10439-020-02616-8. Epub 2021 Feb 9. Ann Biomed Eng. 2021. PMID: 33560467 Free PMC article. Review.
Cited by
-
On the application of entropic half-life and statistical persistence decay for quantification of time dependency in human gait.J Biomech. 2020 Jul 17;108:109893. doi: 10.1016/j.jbiomech.2020.109893. Epub 2020 Jun 13. J Biomech. 2020. PMID: 32636006 Free PMC article.
-
Sampling rate influences the regularity analysis of temporal domain measures of walking more than spatial domain measures.Gait Posture. 2021 Jul;88:216-220. doi: 10.1016/j.gaitpost.2021.05.031. Epub 2021 Jun 4. Gait Posture. 2021. PMID: 34118746 Free PMC article.
-
Cognitive Loading Produces Similar Change in Postural Stability in Patients With Chronic Ankle Instability and Controls.Athl Train Sports Health Care. 2020 Nov;12(6):249-256. doi: 10.3928/19425864-20200610-02. Epub 2020 Jun 10. Athl Train Sports Health Care. 2020. PMID: 37982021 Free PMC article.
-
Sampling frequency influences sample entropy of kinematics during walking.Med Biol Eng Comput. 2019 Apr;57(4):759-764. doi: 10.1007/s11517-018-1920-2. Epub 2018 Nov 3. Med Biol Eng Comput. 2019. PMID: 30392162 Free PMC article. Clinical Trial.
-
The Fidget Factor and the obesity paradox. How small movements have big impact.Front Sports Act Living. 2023 Apr 3;5:1122938. doi: 10.3389/fspor.2023.1122938. eCollection 2023. Front Sports Act Living. 2023. PMID: 37077429 Free PMC article.
References
-
- Shannon C. A Mathematical Theory of Communication. Bell System Technical Journal. 1948;273:379–423.
-
- Pincus S, Huang W. Approximate Entropy - Statistical Properties and Applications. Communications in Statistics-Theory and Methods. 1992;2111:3061–77.
-
- Lake DE, Richman JS, Griffin MP, Moorman JR. Sample entropy analysis of neonatal heart rate variability. Am J Physiol Regul Integr Comp Physiol. 2002;2833:R789–97. - PubMed
-
- Richman JS, Moorman JR. Physiological time-series analysis using approximate entropy and sample entropy. Am J Physiol Heart Circ Physiol. 2000;2786:H2039–49. - PubMed
Publication types
MeSH terms
Grants and funding
LinkOut - more resources
Full Text Sources
Other Literature Sources
Research Materials
