. 2017 Nov 16;2(22):e92724.
doi: 10.1172/jci.insight.92724.

Clonal relationships of CSF B cells in treatment-naive multiple sclerosis patients

Clonal relationships of CSF B cells in treatment-naive multiple sclerosis patients

Erica L Eggers et al. JCI Insight. .

Abstract

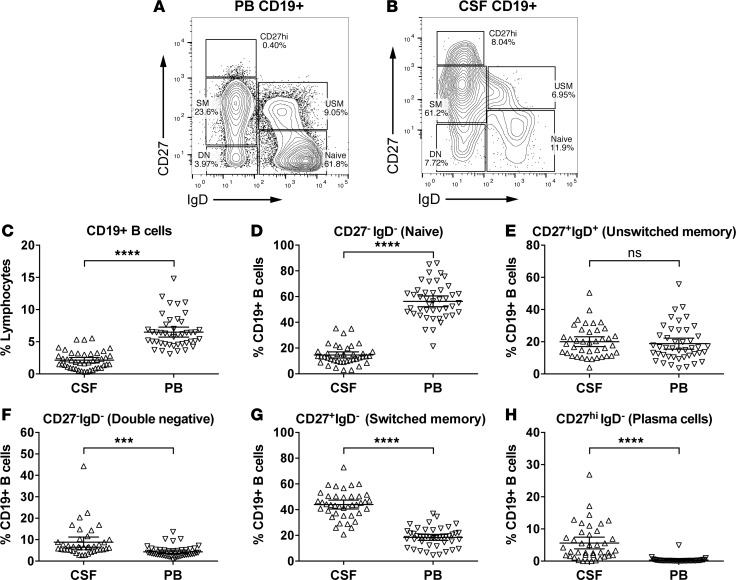
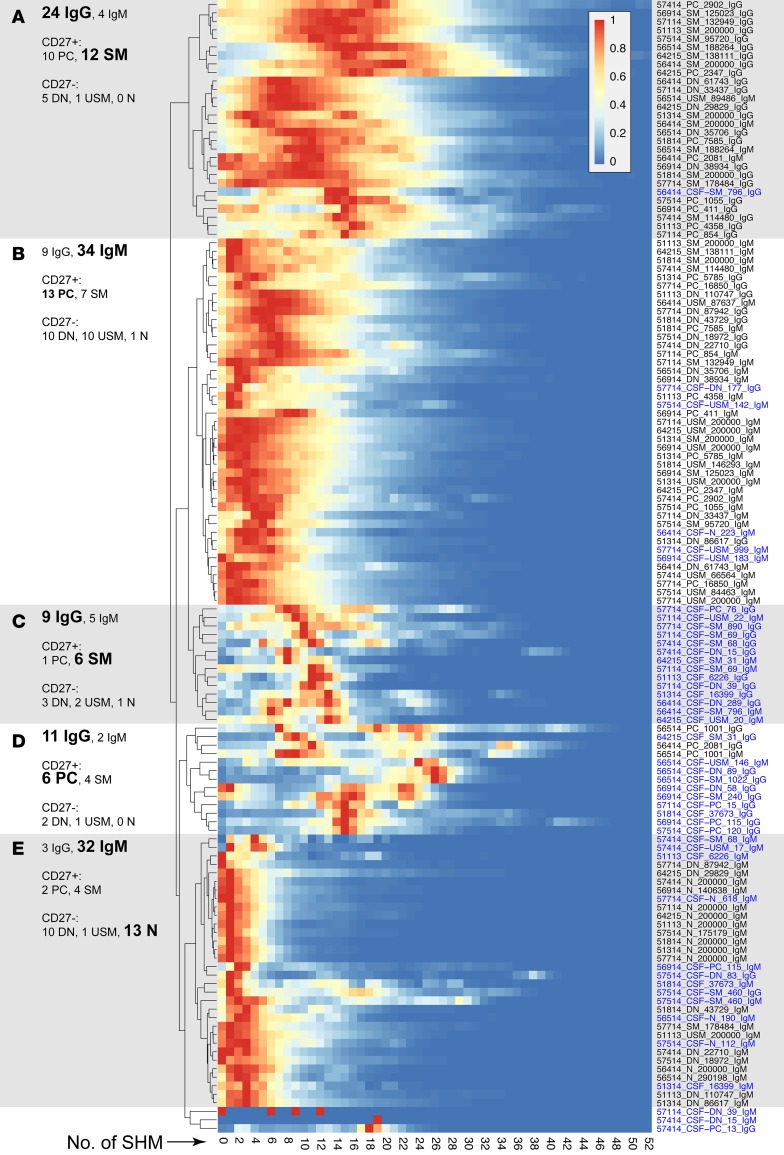
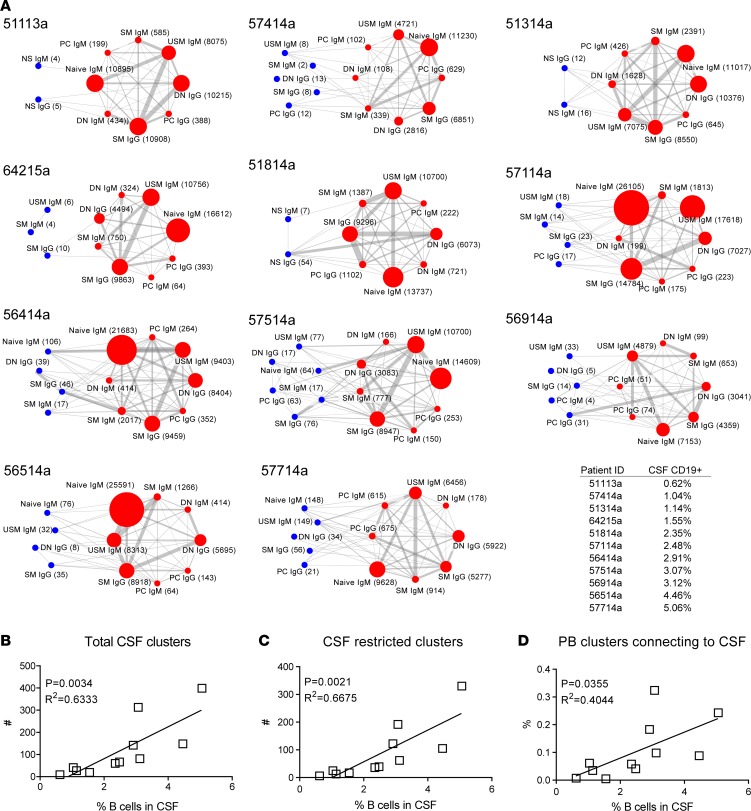
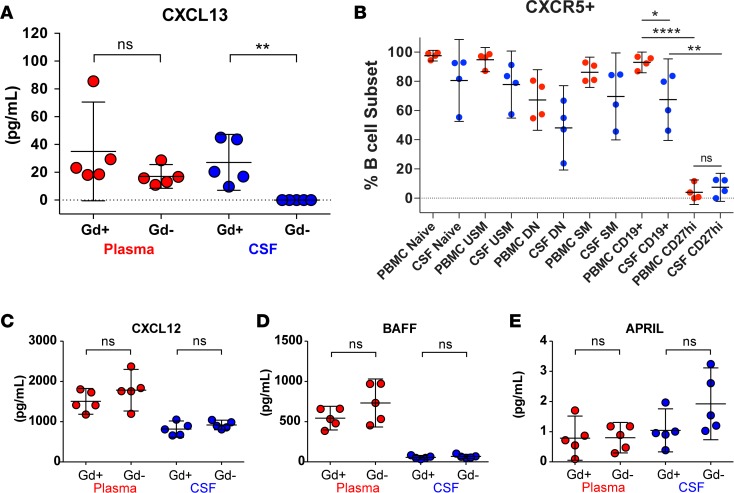
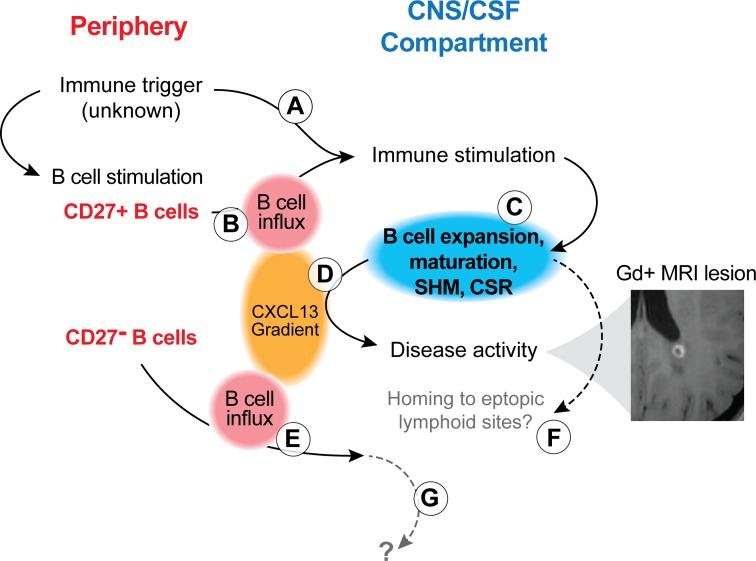
A role of B cells in multiple sclerosis (MS) is well established, but there is limited understanding of their involvement during active disease. Here, we examined cerebrospinal fluid (CSF) and peripheral blood (PB) B cells in treatment-naive patients with MS or high-risk clinically isolated syndrome. Using flow cytometry, we found increased CSF lymphocytes with a disproportionate increase of B cells compared with T cells in patients with gadolinium-enhancing (Gd+) lesions on brain MRI. Ig gene heavy chain variable region (Ig-VH) repertoire sequencing of CSF and PB B cells revealed clonal relationships between intrathecal and peripheral B cell populations, which could be consistent with migration of B cells to and activation in the CNS in active MS. In addition, we found evidence for bystander immigration of B cells from the periphery, which could be supported by a CXCL13 gradient between CSF and blood. Understanding what triggers B cells to migrate and home to the CNS may ultimately aid in the rational selection of therapeutic strategies to limit progression in MS.

Keywords: Autoimmunity; B cells; Multiple sclerosis; Neuroscience.


Conflict of interest statement

Conflict of interest: During the study conception and execution, HCVB was full-time faculty at the UCSF. At the time of submission, HCVB was a full-time employee of F. Hoffmann-La Roche. HCVB has received compensation for consulting activities from Roche, Novartis, and Genzyme and research funding from Roche, Genentech, and Pfizer. SLH serves on the scientific advisory boards for Symbiotix, Annexon, Bionure, Neurona Therapeutics, and Molecular Stethoscope. SLH reports receiving travel reimbursement and writing assistance from F. Hoffmann-La Roche for CD20-related meetings and presentations. BACC has received compensation for consulting activities from Biogen, EMD Serono, and Teva.

Figures

Figure 1
Figure 1. CSF lymphocytes are dominated by T cells, but B cells are disproportionately increased in active MS.
While most CSF lymphocytes are T cells, the overall proportion of B cells (CD19) (A) but not of T cells (CD3) (B) is significantly increased in Gd+ versus Gd patients. Reflective of an inflammatory state during active MS, the absolute numbers of both B cells (C) and T cells (D) are increased in Gd+ patients. However, there is a disproportionate increase in B cells versus T cells in active disease, as indicated by a significantly higher B/T cell ratio, based on cell number per ml in Gd+ patients (E). Shown are data from patients with active MS (Gd+ lesions on brain MRI) and without Gd-enhancing (Gd) lesions. Refer to Supplemental Table 1 for more information on the patients analyzed. Data are shown as scatter plots with mean ± 95% CI. Comparisons were made using an unpaired t test (GraphPad Prism); **P < 0.01, ****P < 0.0001.
Figure 2
Figure 2. B cell subsets in CSF and PB.
Shown are representative FACS plots of peripheral blood (PB) (A) and cerebrospinal fluid (CSF) (B) CD19+ B cell subsets (patient 56414), as defined based on the expression of IgD and CD27. The graphs in CH summarize data from all patients, i.e., both Gd+ and Gd patients combined, to provide an overall picture of B cell subset distribution in both compartments. CD19+ B cells are approximately 3-fold lower in CSF (C, 6.7% ± 2.6% in PB versus 2.25% ± 1.4% in CSF). The CSF contains B cell subpopulations predominantly that have undergone somatic rearrangement of their B cell receptors (F–H). Among CD19+ B cells, in CSF compared with PB, naive are approximately 5-fold lower (D, 56.8% ± 14.2% in PB versus 11.5% ± 7.6% in CSF); USM are slightly increased (E, 19.1% ± 11.7% in PB versus 22.8% ± 10.4% in CSF); DN are increased (F, 4.0% ± 2.5% in PB versus 7.7% ± 7.3% in CSF); and SM are increased 2.5-fold (G, 18% ± 7.5% in PB versus 45.9% ± 11.8% in CSF). Most significantly, the percentage of CD27hi B cells was increased 34-fold in CSF (H, 0.2% ± 0.2% in PB versus 7.6% ± 7.9% in CSF). Refer to Supplemental Table 1 for more information on the patients analyzed. Data are shown as scatter plots with mean ± 95% CI. Comparisons were made using paired t tests; ***P < 0.01, ****P < 0.0001.
Figure 3
Figure 3. The abundance of antigen-induced B cells is increased in Gd+ CSF.
In CSF of patients with Gd-enhancing lesions on brain MRI, B cell subsets resulting from antigen-driven stimulation are increased in numbers (D and E). Other B cell subpopulations appeared increased as well but not in a significant fashion (A–C). (F) The fold difference of the mean number of each B cell subset between Gd+ and Gd CSF, showing the greatest increase of CD27hi B cells. Shown are scatter plots with each point representing findings from a single patient, and all data are shown as mean ± 95% CI, except for those in E, where the ratio of means is shown and therefore no error bars can be calculated. Refer to Supplemental Table 1 for more information on the patients analyzed in AE. Comparisons were made using an unpaired t test; *P < 0.05, **P < 0.01.
Figure 4
Figure 4. Hierarchical clustering of SHM profiles.
Profiles of SHM along the analyzed IGHV portion of Ig-VH were normalized to the peak (=1, red) and subjected to unsupervised hierarchical clustering. In general, post-GC subsets display higher and naive B cells display lower levels of SHM. (A) Higher level SHM can be found in IgG-expressing SM B cells and PCs. (B) Lower level SHM can be found in IgM-expressing SM B cells and PCs. (C and D) Predominantly IgG-expressing CSF-derived SM B cells and PCs form separate clusters. (E) Lowest level SHM can be found among mostly IgM-expressing naive B cells. Each row represents an individual B cell sample, as indicated by sample names containing patient ID, B cell subset, number of cells analyzed, and Ig isotype separated by “_”. CSF B cells subsets are indicated by “CSF” before the subset designation and blue type. N, naive B cells; USM, unswitched-memory B cells; DN, double-negative B cells; SM, switched-memory B cells; PC, plasma cells/plasmablasts.
Figure 5
Figure 5. Increased CSF B cells correlate with CSF B cell diversity and B cell influx.
(A) From the top left to bottom right, networks are ordered per percentage of CD19+ B cells among CSF lymphocytes. Nodes represent CSF (blue) or PB (red) B cell subsets subjected to Ig-RepSeq (NS, nonsorted; N, naive B cells; DN CD27IgD double-negative B cells; SM, switched-memory B cells; CD27hi, plasmablasts/plasma cells); for each population, relevant Ig isotypes were obtained by using IgG- and IgM-specific primers. Numbers in parentheses represent the number of Ig-VH clusters identified per subpopulation. Edges (lines) between nodes indicate clonal connections between subsets. Node size and edge thickness are relative to the number of Ig-VH clusters or connections, respectively. The displayed networks greatly simplify the highly complex picture of clonal relationships between B cell subsets; see Supplemental Table 3 for a listing of all CSF clusters and respective clonal connections to CSF and/or PB B cell subsets. (B) Correlation between CSF B cell proportion and total number of CSF B cell clusters. (C) Correlation between CSF B cell proportion and number of B cell clusters that can be exclusively found in the CSF. (D) Correlation between CSF B cells and proportion of peripheral blood B cells that form a connection to the CSF compartment (B cell influx). Standard linear regression was used to determine goodness of fit and significance.
Figure 6
Figure 6. Clonal relationships between CSF naive, USM, and CD27hi B cells and other CSF or peripheral blood B cells suggest recruitment of antigen-specific and nonspecific B cells.
CSF B cell subsets are in blue type; PB subsets are in red type. Numbers represent number of clusters identified containing clonally related Ig-VH from both connected subsets; in the CD27hi column, blue numbers represent CSF-restricted Ig-VH clusters, red numbers represent clusters comprising CSF and PB subsets. For simplicity, only the direct connections between the CSF subset of interest (bold blue type) and other subsets are shown. See Supplemental Figure 3 for an example detailed overview of clonal connections between CSF-naive B cells and other CSF or PB subsets (patient 56414). For comprehensive information on clonal relationships between CSF B cells and other subsets see Supplemental Table 4. n.a., not available, i.e., CSF subset not obtained flow cytometry sorting; N, naive B cells; USM, unswitched-memory B cells; DN, double-negative B cells; SM, switched-memory B cells; PC, plasma cells/plasmablasts.
Figure 7
Figure 7. Locally produced CXCL13 may drive B cell recruitment to the CNS.
CXCL13 was undetectable in CSF from Gd patients, while CXCL13 levels in plasma and Gd+ CSF were similar (A). CXCR5 is expressed on the majority of CSF and PBMC B cells (B). In combination, CXCR5 is present on more PBMCs than CSF CD19+ B cells and only expressed on a minority of PBMCs and CSF CD27hi plasmablasts/plasma cells. There was no significant difference between CXCL12 (C), BAFF (D), and APRIL (E) in CSF from Gd+ or Gd patients. Overall CXCL12 and BAFF levels were higher in plasma than in CSF. Cytokine/chemokine concentrations were determined in CSF and plasma samples from Gd+ and Gd patients by ELISA (n = 5 per group; see Table 1). Data are shown as scatter plots with mean ± 95% CI. Comparisons were made using unpaired or paired t tests; *P < 0.05, **P < 0.01, ****P < 0.0001. N, naive B cells; USM, unswitched-memory B cells; DN, double-negative B cells; SM, switched-memory B cells; PC, plasma cells/plasmablasts.
Figure 8
Figure 8. Model of B cell activation and involvement during MS disease activity.
Peripheral immune activation can lead to intrathecal immune stimulation, either via antigen nonspecific (A; e.g., via cytokines during an infectious disease) or antigen-specific (B; via preformed CD27+IgD SM) mechanisms. This immune activation involves B and T cells, as supported by our flow cytometry findings and those of others (24) (Figures 1–3), and leads to B cell activation, modification of the B cell receptor (somatic hypermutation [SHM]; Ig-class switch recombination [CSR]) and B cell maturation (C). B cell influx and intrathecal B cell expansion are supported by Ig-RepSeq (Figures 5 and 6). These immune mechanisms support MS disease activity (evidenced by Gd+ MRI lesions; example from patient 57514) and lead to increased production of CXCL13 (D), which, in turn, also attracts CD27 B cells to the CNS/CSF compartment (E). These CD27 B cells may not have been involved in the initial peripheral immune triggering event; rather, their migration to the CNS could be a nonspecific event. Activated CD27+ B cells, once in the CNS, may further mature to antibody-secreting plasmablasts/plasma cells and may home to ectopic lymphoid sites (F). We found no evidence for CD27 IgD+ B cells maturing to antigen-specific CD27+ B cell subset; the fate of naive B cells in CSF remains unknown (G). It is important to note that several steps described in this model remain hypothetical and subject of future research.

Similar articles

Cited by

References

    1. Bar-Or A, et al. Rituximab in relapsing-remitting multiple sclerosis: a 72-week, open-label, phase I trial. Ann Neurol. 2008;63(3):395–400. doi: 10.1002/ana.21363. - DOI - PubMed
    1. Hauser SL, et al. B-cell depletion with rituximab in relapsing-remitting multiple sclerosis. N Engl J Med. 2008;358(7):676–688. doi: 10.1056/NEJMoa0706383. - DOI - PubMed
    1. Kappos L, et al. Ocrelizumab in relapsing-remitting multiple sclerosis: a phase 2, randomised, placebo-controlled, multicentre trial. Lancet. 2011;378(9805):1779–1787. doi: 10.1016/S0140-6736(11)61649-8. - DOI - PubMed
    1. Sorensen PS, et al. Safety and efficacy of ofatumumab in relapsing-remitting multiple sclerosis: a phase 2 study. Neurology. 2014;82(7):573–581. doi: 10.1212/WNL.0000000000000125. - DOI - PubMed
    1. Hauser SL, et al. Ocrelizumab versus interferon beta-1a in relapsing multiple sclerosis. N Engl J Med. 2017;376(3):221–234. doi: 10.1056/NEJMoa1601277. - DOI - PubMed

Publication types