. 2017 Nov 16;2(22):e95512.
doi: 10.1172/jci.insight.95512.

Increased Ca2+ signaling through CaV1.2 promotes bone formation and prevents estrogen deficiency-induced bone loss

Affiliations

Increased Ca2+ signaling through CaV1.2 promotes bone formation and prevents estrogen deficiency-induced bone loss

Chike Cao et al. JCI Insight. .

Abstract

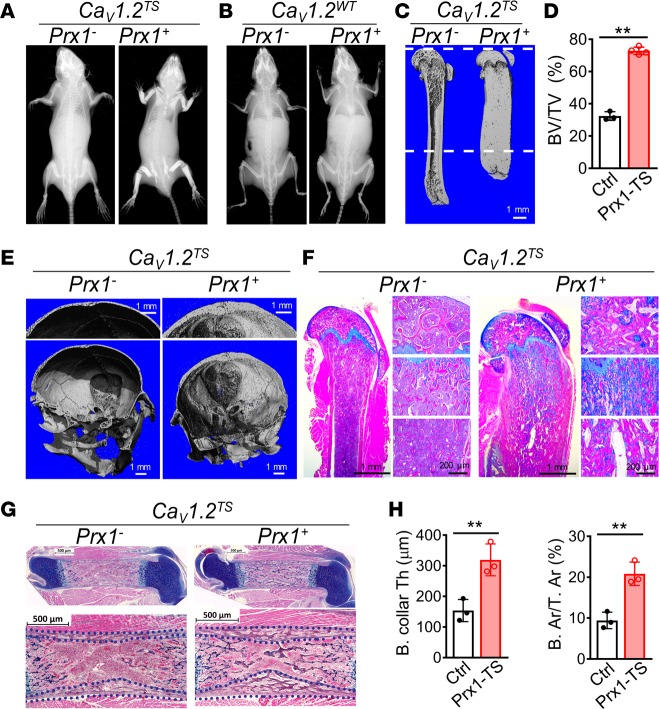
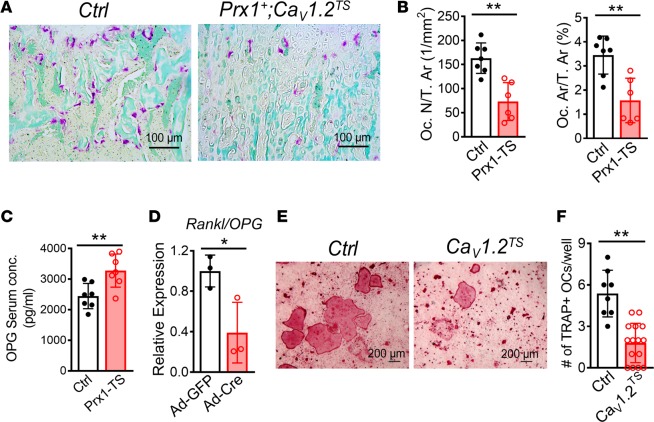
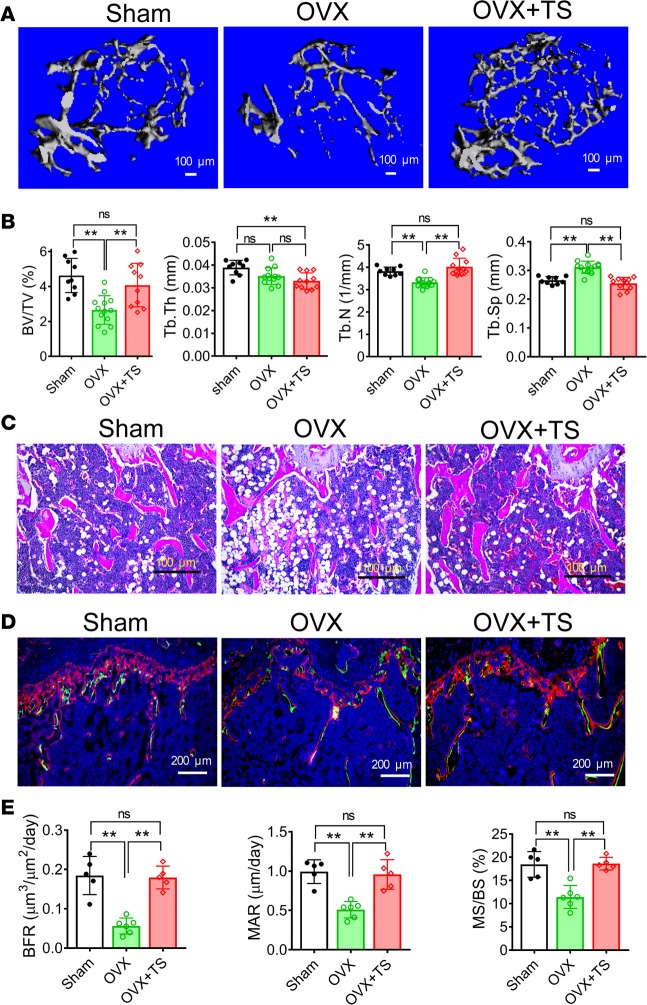
While the prevalence of osteoporosis is growing rapidly with population aging, therapeutic options remain limited. Here, we identify potentially novel roles for CaV1.2 L-type voltage-gated Ca2+ channels in osteogenesis and exploit a transgenic gain-of-function mutant CaV1.2 to stem bone loss in ovariectomized female mice. We show that endogenous CaV1.2 is expressed in developing bone within proliferating chondrocytes and osteoblasts. Using primary BM stromal cell (BMSC) cultures, we found that Ca2+ influx through CaV1.2 activates osteogenic transcriptional programs and promotes mineralization. We used Prx1-, Col2a1-, or Col1a1-Cre drivers to express an inactivation-deficient CaV1.2 mutant in chondrogenic and/or osteogenic precursors in vivo and found that the resulting increased Ca2+ influx markedly thickened bone not only by promoting osteogenesis, but also by inhibiting osteoclast activity through increased osteoprotegerin secretion from osteoblasts. Activating the CaV1.2 mutant in osteoblasts at the time of ovariectomy stemmed bone loss. Together, these data highlight roles for CaV1.2 in bone and demonstrate the potential dual anabolic and anticatabolic therapeutic actions of tissue-specific CaV1.2 activation in osteoblasts.

Keywords: Bone Biology; Bone development; Calcium channels; Osteoclast/osteoblast biology.


Conflict of interest statement

Conflict of interest: The authors have declared that no conflict of interest exists.

Figures

Figure 1
Figure 1. Endogenous CaV1.2 is expressed during mouse endochondral ossification and in BMSCs, and pharmacological inhibition of CaV1.2 channel activity decreases osteoblast differentiation.
(A) LacZ staining of CaV1.2+/lacZ femur at P10 at 5× magnification. (B–E) Boxed regions shown in A indicate the presence of lacZ+ cells in the resting (B) and proliferating (C) chondrocytes, in the perichondrium/periosteum (D), and in the lining cells of trabecular bones (E). (F) LacZ staining of CaV1.2+/lacZ tibia at P18, showing lacZ staining in the endosteum. (G) LacZ staining of CaV1.2+/lacZ BMSCs cultured for 6 days on coverslip in α-MEM (without ascorbic acid) plus 15% FBS and 1% penicillin/streptomycin. (H) von Kossa staining of WT BMSCs after 14 days of differentiation in the presence of the L-type Ca2+ channel–specific blockers diltiazem (10 μM) or nifedipine (10 μM), n ≥ 3. (I) Expression analysis of osteoblast markers by quantitative PCR of WT BMSCs after 9 days of differentiation in the absence and presence of diltiazem (10 μM). Bar values are normalized means (normalized to H2O group) ± SD (n = 3, **P < 0.01). Statistical analysis was performed by 2-tailed unpaired t test.
Figure 2
Figure 2. Expression of the CaV1.2TS channel increases bone mass in vivo.
(A and B) Radiographs of the whole bodies of 6-week-old Cre;CaV1.2TS (control) and Prx1-Cre;CaV1.2TS (mutant) littermate mice. (C) μCT 3-D reconstruction images of the femurs of 6-week-old Cre;CaV1.2TS (control, Prx1-) and Prx1-Cre;CaV1.2TS (mutant, Prx1+) littermate mice. (D) μCT analysis of BV/TV obtained from 800 slices (10-μm thick; 8 mm total) from the distal femur, a region indicated by the dashed lines in C. Bar values are means ± SD (n ≥ 3, **P < 0.01). (E) μCT 3-D reconstruction images of skulls of 6-week-old Cre;CaV1.2TS and Prx1-Cre;CaV1.2TS littermate mice. (F) Alcian blue Hematoxylin/Orange G (ABH/OG) staining of longitudinal femur sections from 6-week-old Cre;CaV1.2TS and Prx1-Cre;CaV1.2TS littermate mice at 1.25× magnification. Shown to the right of the main images are 10× magnifications of the secondary ossification center (top), primary spongiosa (middle), and marrow region (bottom). (G) ABH/OG staining of longitudinal femur sections from Cre;CaV1.2TS and Prx1-Cre;CaV1.2TS littermate mice at P0. (H) Analysis of bone collar thickness (B. collar Th) and percentage of bone area over tissue area (B. Ar/T. Ar) of femur diaphysis from Cre;CaV1.2TS and Prx1-Cre;CaV1.2TS littermate mice at P0. Bar values are means ± SD (n = 3. **P < 0.01). Statistical analysis was performed by 2-tailed unpaired t test.
Figure 3
Figure 3. CaV1.2TS channel promotes osteoblast differentiation.
(A) Representative images of calcein and alizarin red double labeling in femurs from 6-week-old control Cre;CaV1.2TS and Prx1-Cre;CaV1.2TS littermate mice. (B) Analysis of the percentage of double-labeling area over tissue area underneath the growth plate (Dl. Ar/T. Ar) in control Cre;CaV1.2TS (Ctrl) and Prx1-Cre;CaV1.2TS (Prx1-TS) littermate mice. Bar values are means ± SD (n = 3. *P < 0.05). (C) von Kossa staining of control (Ad-GFP) versus CaV1.2TS-expressing (Ad-Cre) BMSCs after 10 days of differentiation, n ≥ 3. (D) Expression analysis by quantitative PCR of control (Ad-GFP) versus CaV1.2TS-expressing (Ad-Cre) BMSCs at D0 (6 hours of differentiation) or after 2, 10 and 17 days (D2, D10, and D17) of differentiation. Bar values are means ± SD (n = 3. *P < 0.05 and **P < 0.01). Statistical analysis was performed by 2-tailed unpaired t test, and a P value less than 0.05 was considered significant.
Figure 4
Figure 4. CaV1.2TS channel decreases osteoclast differentiation.
(A) Representative images of TRAP staining in femur sections from 6-week-old control (Cre;CaV1.2TS) and Prx1-Cre;CaV1.2TS littermate mice. (B) Analysis of osteoclast number (Oc. N) or osteoclast area (Oc. Ar) over tissue area (T. Ar) underneath the growth plate. Bar values are means ± SD (n ≥ 6. **P < 0.01). (C) Serum OPG levels of control Cre;CaV1.2TS and Prx1-Cre;CaV1.2TS littermate mice at 6 weeks old. Bar values are means ± SD (n = 7. **P < 0.01). (D) Expression analysis of Rankl/Opg mRNA ratio by qPCR of control (Ad-GFP) versus CaV1.2TS-expressing (Ad-Cre) BMSCs after 8 days (D8) of differentiation. Bar values are means ± SD (n = 3. *P < 0.05). (E) Representative images of TRAP-stained cells in cocultures of BMMs and control (Cre;CaV1.2TS) or CaV1.2TS-expressing (Sp7-Cre;CaV1.2TS) calvarial osteoblasts in the presence of 10 nM 1,25-dihydroxyvitamin D3 and 1 μm prostaglandin E2, n = 3. (F) Analysis of the number of TRAP-positive cells per well. Bar values are means ± SD (n ≥ 10. **P < 0.01). Statistical analysis was performed by 2-tailed unpaired t test, and a P value less than 0.05 was considered significant.
Figure 5
Figure 5. CaV1.2TS prevents estrogen deficiency–induced bone loss.
(A) μCT 3-D reconstruction images of metaphyses of distal femurs of mice 8 weeks after sham surgery, ovariectomy [OVX], and OVX with CaV1.2TS expression (Sp7-Cre;CaV1.2TS). (B) Analysis of bone volume density (BV/TV), trabecular thickness (Tb.Th), trabecular number (Tb.N), and trabecular spacing (Tb.Sp) of metaphyses of distal femurs of mice 8 weeks after sham surgery, OVX, or OVX with CaV1.2TS expression (Sp7-Cre+;CaV1.2TS). Bar values are means ± SD (n ≥ 8. **P < 0.01). (C) H&E staining of mice 8 weeks after sham surgery, OVX, or OVX with CaV1.2TS expression (Sp7-Cre;CaV1.2TS). (D) Representative images of calcein and alizarin red double labeling in the trabecular bones underneath the growth plate of mice 8 weeks after sham surgery, OVX, or OVX with CaV1.2TS expression (Sp7-Cre;CaV1.2TS). (E) Dynamic histomorphometry analysis of trabecular bones 1.5 mm away from the growth plate of mice 8 weeks after sham surgery, OVX, or OVX with CaV1.2TS expression (Sp7-Cre;CaV1.2TS). BFR, bone formation rate; MAR, mineral apposite rate; and MS/BS, percentage of mineralizing surface over bone surface. Bar values are means ± SD (n ≥ 8. *P < 0.05 and **P < 0.01). Statistical analysis was performed by one-way ANOVA followed by Tukey’s post-test analysis, and a P value less than 0.05 was considered significant.

Similar articles

Cited by

References

    1. Catterall WA. Structure and regulation of voltage-gated Ca2+ channels. Annu Rev Cell Dev Biol. 2000;16:521–555. doi: 10.1146/annurev.cellbio.16.1.521. - DOI - PubMed
    1. Hatanaka T, Hatanaka Y, Tsuchida J, Ganapathy V, Setou M. Amino acid transporter ATA2 is stored at the trans-Golgi network and released by insulin stimulus in adipocytes. J Biol Chem. 2006;281(51):39273–39284. doi: 10.1074/jbc.M604534200. - DOI - PubMed
    1. Splawski I, et al. Ca(V)1.2 calcium channel dysfunction causes a multisystem disorder including arrhythmia and autism. Cell. 2004;119(1):19–31. doi: 10.1016/j.cell.2004.09.011. - DOI - PubMed
    1. Ramachandran KV, et al. Calcium influx through L-type CaV1.2 Ca2+ channels regulates mandibular development. J Clin Invest. 2013;123(4):1638–1646. doi: 10.1172/JCI66903. - DOI - PMC - PubMed
    1. Zahanich I, Graf EM, Heubach JF, Hempel U, Boxberger S, Ravens U. Molecular and functional expression of voltage-operated calcium channels during osteogenic differentiation of human mesenchymal stem cells. J Bone Miner Res. 2005;20(9):1637–1646. doi: 10.1359/JBMR.050521. - DOI - PubMed

Publication types

MeSH terms