. 2018 Jan 2;128(1):190-206.
doi: 10.1172/JCI95161. Epub 2017 Nov 20.

Patients and animal models of CNGβ1-deficient retinitis pigmentosa support gene augmentation approach

Affiliations

Patients and animal models of CNGβ1-deficient retinitis pigmentosa support gene augmentation approach

Simon M Petersen-Jones et al. J Clin Invest. .

Abstract

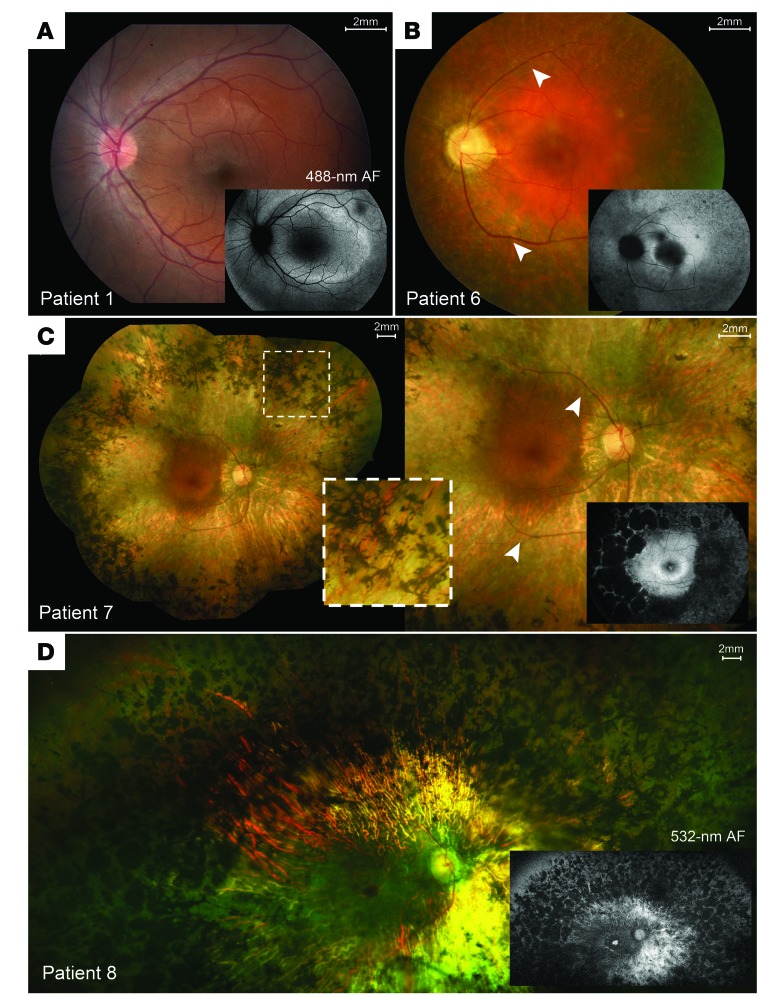
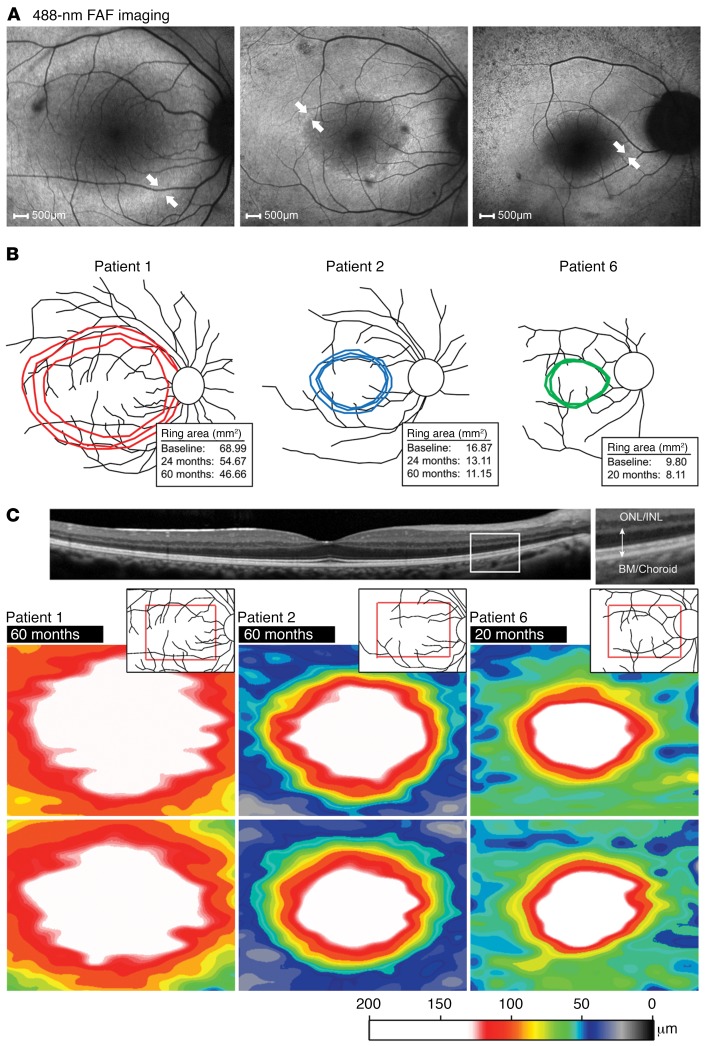
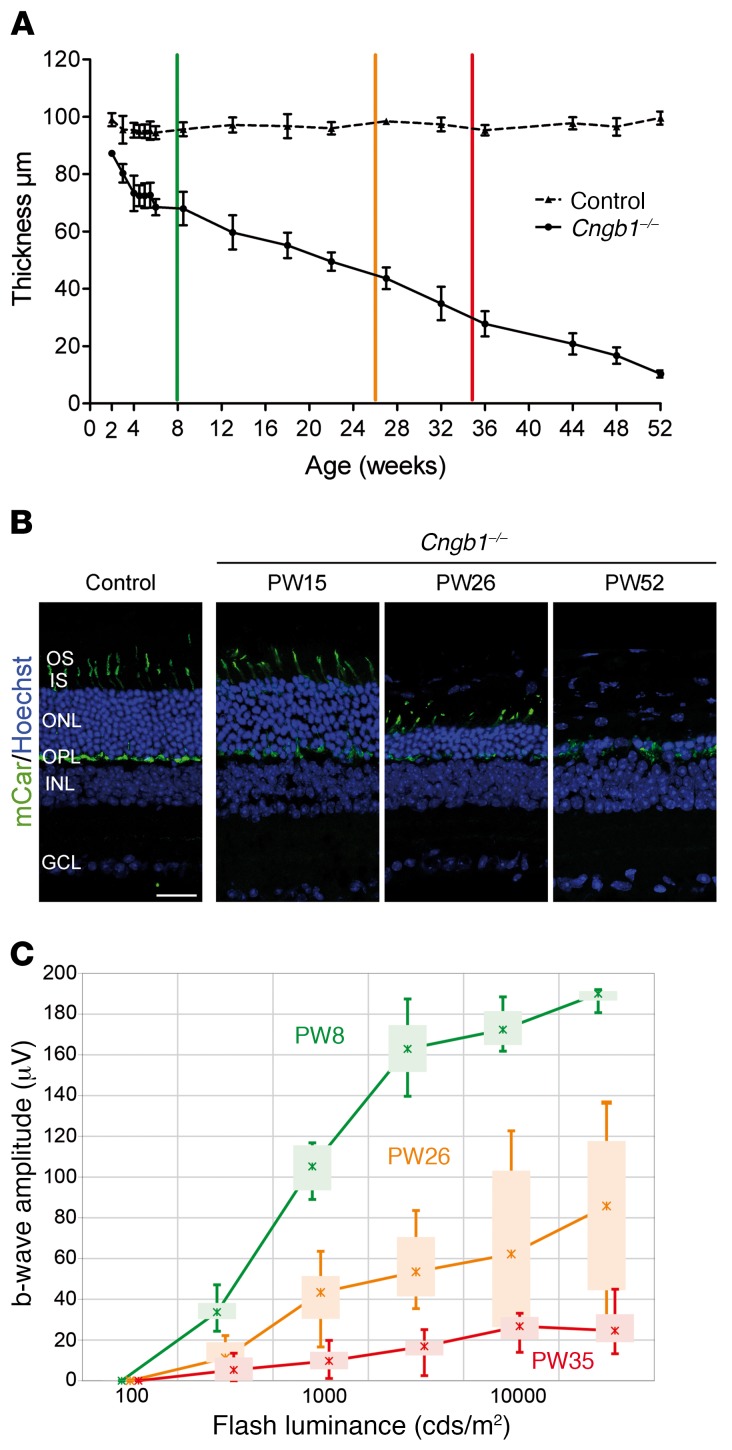
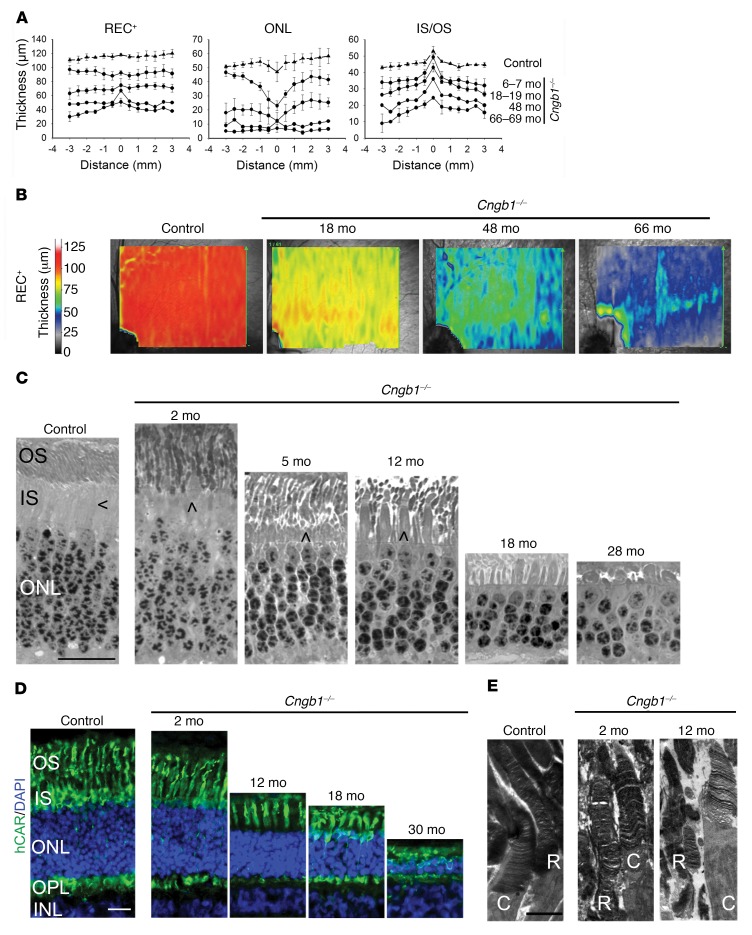
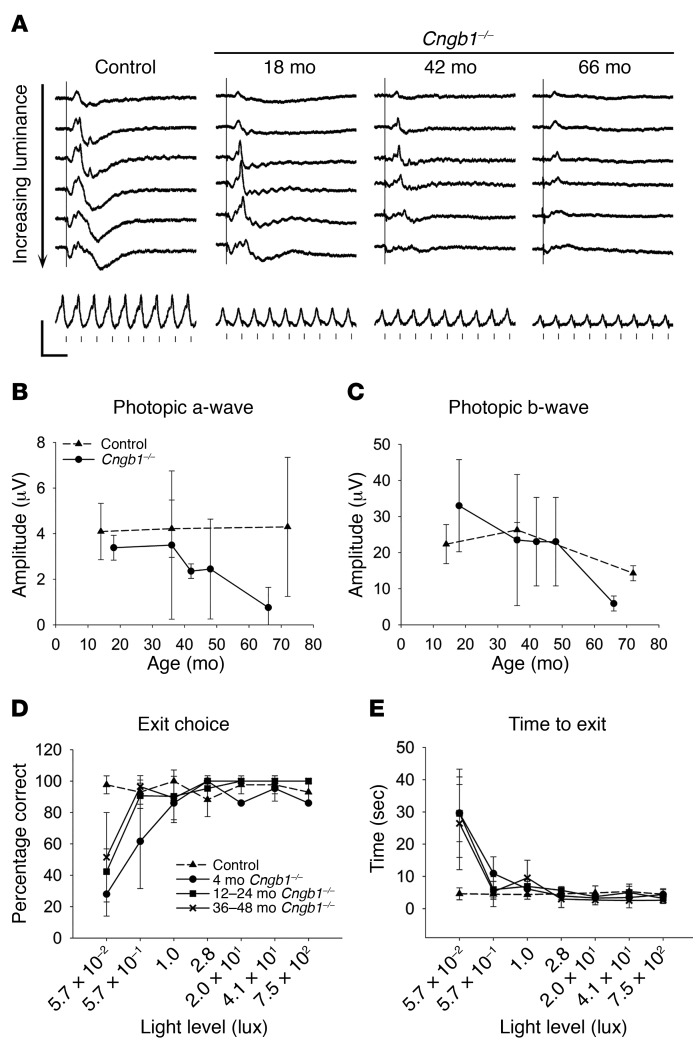
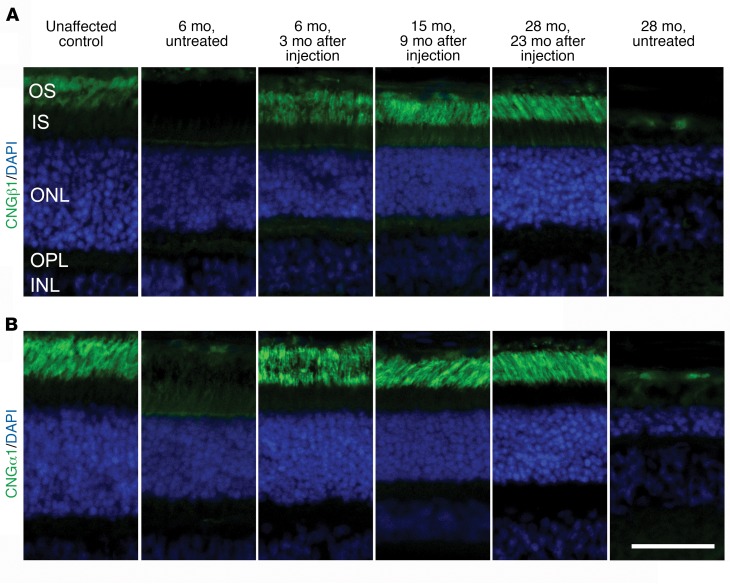
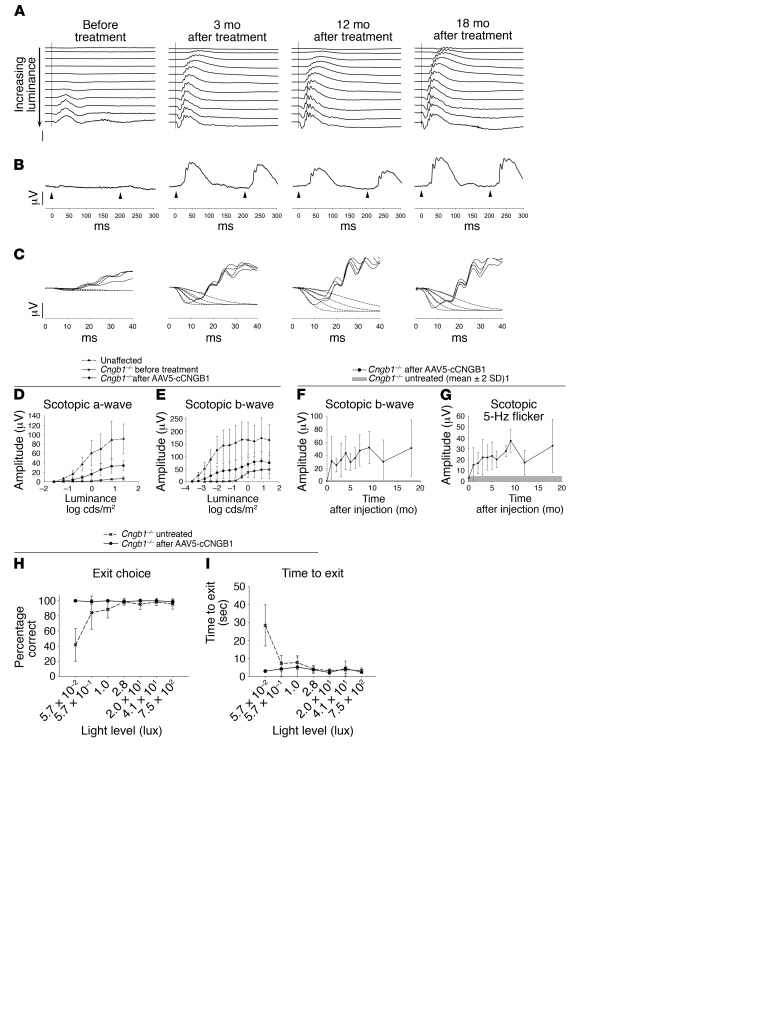
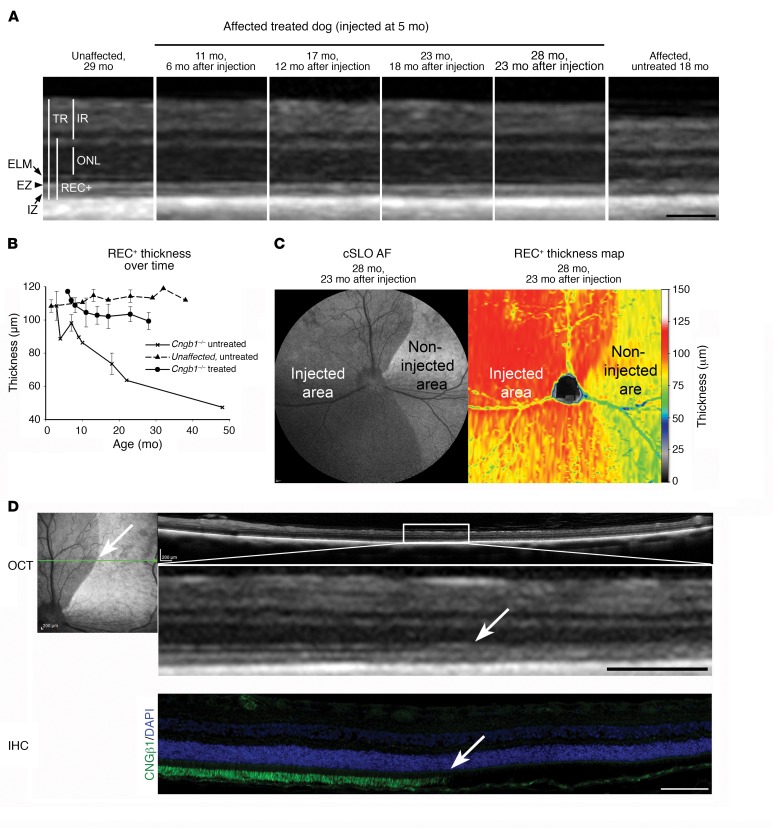
Retinitis pigmentosa (RP) is a major cause of blindness that affects 1.5 million people worldwide. Mutations in cyclic nucleotide-gated channel β 1 (CNGB1) cause approximately 4% of autosomal recessive RP. Gene augmentation therapy shows promise for treating inherited retinal degenerations; however, relevant animal models and biomarkers of progression in patients with RP are needed to assess therapeutic outcomes. Here, we evaluated RP patients with CNGB1 mutations for potential biomarkers of progression and compared human phenotypes with those of mouse and dog models of the disease. Additionally, we used gene augmentation therapy in a CNGβ1-deficient dog model to evaluate potential translation to patients. CNGB1-deficient RP patients and mouse and dog models had a similar phenotype characterized by early loss of rod function and slow rod photoreceptor loss with a secondary decline in cone function. Advanced imaging showed promise for evaluating RP progression in human patients, and gene augmentation using adeno-associated virus vectors robustly sustained the rescue of rod function and preserved retinal structure in the dog model. Together, our results reveal an early loss of rod function in CNGB1-deficient patients and a wide window for therapeutic intervention. Moreover, the identification of potential biomarkers of outcome measures, availability of relevant animal models, and robust functional rescue from gene augmentation therapy support future work to move CNGB1-RP therapies toward clinical trials.

Keywords: Gene therapy; Genetic diseases; Ophthalmology; Retinopathy.


Conflict of interest statement

Conflict of interest: W.W. Hauswirth and the University of Florida have a financial interest in the use of adeno-associated virus (AAV) therapies and own equity in a company (AGTC) that might, in the future, commercialize some aspects of this work.

Figures

Figure 1
Figure 1. Spectrum of disease severity in patients with CNGB1-associated RP.
Color fundus montages and corresponding AF images of the left eye of patient 1 (p.Phe1051Leufs*12 homozygous) (A), patient 6 (p.Leu849Profs*3; p.Lys175Glnfs*4) (B), and the right eyes of patient 7 (p.Cys632*; p.Phe1051Leufs*12) (C) and patient 8 (p.Arg762Cys homozygous), illustrating typical presentations of RP features: (BD) waxy pallor of the optic disc, severe attenuation of the retinal vasculature (white arrowheads), and bone-spicule pigment clumping in the mid-periphery (insets). (A) The left macula of patient 1 (p.Phe1051Leufs*12 homozygous) shows largely unremarkable features for retinal degeneration. REC+ thickness is defined as all visiblelayers between the inner nuclear layer-outer nuclear layer (INL/ONL) complex and the Bruch’s membrane-choroidal (BM/Choroid) interface.
Figure 2
Figure 2. Progressive AF ring constriction and photoreceptor layer thinning in affected patients homozygous and compound heterozygous for CNGB1 mutations.
Affected patients homozygous for CNGB1: patients 1 and 2 (p.Phe1051Leufs*12); affected patient heterozygous for CNGB1: patient 6 (p.Leu849Profs*3, p.Lys175Glnfs*4). (A) FAF imaging (488-nm) of the right eye in each patient revealed the inner and outer border (white arrows) of a progressively constricting region (ring), delineating the centrally preserved area of retinal function. (B) Retinal schematic illustrating the constriction size (mm2) and shape of the centrally preserved region over various time intervals (insets): after 60 months in patient 1 (red) and patient 2 (blue) and 20 months in patient 6 (green). (C) Color-coded maps of total REC+ thickness after 60 months in patients 1 and 2 and after 20 months in patient 6 from a segmented macular SD-OCT scan within the position of the retina enclosed in the red rectangle (upper right inset). The right eye of each patient is shown, where white on the color scale (>125 μm) denotes the range of REC+ thickness in healthy eyes. REC+ thickness is defined as all visible layers between the inner nuclear layer–ONL (INL-ONL) complex and the Bruch’s membrane–choroidal interface (SD-OCT, inset). BM, basement membrane.
Figure 3
Figure 3. Cngb1–/– mice show a progressive loss of photoreceptor structure and function.
(A) Age-related loss of the REC+ layer in Cngb1–/– mice compared with WT mice, as measured by SD-OCT imaging. The colored vertical bars indicate the ages at which photopic ERG b-wave amplitudes were measured in C (mean of n = 4–6 for each time point). (B) IHC with a cone marker (cone arrestin) showing morphologically affected but still-persisting cones after advanced thinning of the ONL (representative images from 3 mice). Scale bar: 25 µm. (C) Photopic cone b-wave amplitudes of Cngb1–/– mice plotted against stimulus strength at 2, 6, and 8 months of age (mean of 4 for each time point). Data represent the mean ± SD. PW8, postnatal week 8; PW26, postnatal week 26; PW35, postnatal week 35.
Figure 4
Figure 4. Cngb1–/– dogs have a progressive retinal thinning with preservation of the REC+ in the area centralis.
(A) Measurement of REC+, ONL, and inner segment/outer segment (IS/OS) layer thickness by SD-OCT cross-sectional images in a vertical plane through the area centralis, measured every 0.5 mm. The negative numbers are inferior to the area centralis. Control dogs: n = 3; Cngb1–/– affected dogs: n = 3 dogs 6–7 months of age; n = 3 dogs 18–19 months of age; n = 1 dog 48 months of age; n = 2 dogs 66–69 months of age. (B) Heatmaps demonstrating preservation of photoreceptor thickness in the area centralis and horizontally along the visual streak. REC+ thickness in Cngb1–/– dogs of different ages compared with a control (WT) dog. n = 3 control dogs; n = 3 Cngb1–/– dogs at 18 months of age; n = 1 Cngb1–/– dog at 48 months of age; and n = 2 Cngb1–/– dogs at 66 months of age. (C) Representative images of plastic-embedded semi-thin retinal samples from an 8-week-old control dog compared with samples from a Cngb1–/– dog. The inner segments of cones are located adjacent to the inner segments of rods in the control dog. Shortening of the rod inner segments in the Cngb1–/– dogs resulted in cone inner segments extending to the level of the rod outer segments. Rod outer segments appeared disorganized and deteriorated over the first 28 months. Initially, cone inner segments appeared grossly normal and then, with rod loss, initially appeared widened (at 12 months) but then became shortened and atrophied (at 28 months). Sections (500-nm) were stained with epoxy tissue stain. Arrows indicate the cone inner segment. Scale bar: 20 μm. n = 4 control dogs; n = 1 Cngb1–/– dog at 2, 5, 12, and 28 months of age; n = 2 Cngb1–/– dogs at 18 months of age. (D) Representative images of IHC with hCAR (labels the entire length of the cones) show well-preserved cone morphology in the younger animals. In the older Cngb1–/– affected dogs (18 and 30 months of age), the cones were still visible, albeit shortened. Scale bar: 20 μm. n = 2 control dogs; n = 2 Cngb1–/– dogs at 2 and 18 months of age; n = 1 Cngb1–/– dog at 12 and 30 months of age. (E) Representative transmission electron microscopic images of rods (R) and cones (C) show a reasonably normal arrangement of rod discs at 2 months of age in the Cngb1–/– dog, but by 12 months of age, the rod outer segments had deteriorated, but the cone outer segments appeared relatively normal. Scale bar: 2 μm. n = 4 controls; n = 1 Cngb1–/– dog at 2 and 12 months of age.
Figure 5
Figure 5. Cone function slowly declines with age in the Cngb1–/– dog.
(A) Photopic single-flash ERG tracings in response to the following stimuli in the light-adapted eye present on a background of 30 cd/m2: –0.4, 0.0, 0.4, 0.9, 1.4, and 1.9 log cds/m2 (top to bottom tracings), and at the bottom, a photopic 33-Hz flicker response at 0.4 log cds/m2. (B and C) Change in the mean (± SD) photopic a-wave (B) and b-wave (C) amplitudes in response to the 0.4 log cds/m2 stimulus with age. The mean photopic a-wave amplitude for Cngb1–/– dogs was significantly lower at 42 and 66 months of age (P < 0.05, Student’s t test). The mean photopic b-wave was significantly reduced at 66 months of age (P < 0.01, Student’s t test). n = 2 Cngb1–/– dogs at each time point; n = 3 controls at 14 and 36 months; and n = 2 controls at 72 months. (D and E) Results of vision testing showing the percentage of dogs that made the correct exit choice (D) and the time taken to exit (E). At all ages tested, the affected dogs had reduced visual function at the lowest light level. Bright light vision was maintained in all age groups tested. Control dogs: n = 6; Cngb1–/– dogs: n = 3 for 4-month-old and 12- to 24-month-old dogs and n = 4 for 36- to 48-month-old dogs.
Figure 6
Figure 6. Gene augmentation therapy results in appropriate rod Cngb1 expression and restores Cnga1 expression.
(A) CNGβ1 (green: antibody targeted CNGβ1 distal to the mutation site) was expressed in the outer segments of the treated regions of Cngb1–/– retinae 3, 9, and 23 months after treatment. The untreated region from the retinae 3 months after injection and the 28-month-old untreated Cngb1–/– retinae did not express full-length CNGβ1. (B) CNGα1 (green) was expressed and correctly targeted to the photoreceptor outer segments in the treated regions of Cngb1–/– retinae 3, 9, and 23 months after treatment, but was not detectable in the untreated region. Scale bar: 50 μm.
Figure 7
Figure 7. Sustained rescue of rod function by gene therapy.
(AC) Scotopic ERGs before treatment and 3, 12, and 18 months after subretinal AAV5-hGRK1-cCngb1 treatment (dog 14-055 right eye). (A) Luminance response series. Note the obvious lowering of the response threshold and increased a- and b-wave amplitudes (stimulus luminances ranged from –3.7 to 0.4 log cds/m2). (B) Scotopic 5-Hz flicker responses at –1.6 log cds/m2 luminance (vertical scale bars: 50 μV; horizontal scale bars: 50 ms). (C) Fit of the leading edge of the dark-adapted a-wave to the Hood and Birch model. The solid lines are the raw ERG data and the dotted lines the derived fits to the leading edge of the a-wave. (D and E) Mean (± SD) stimulus response ERG plots for scotopic a- and b-waves comparing unaffected control dogs (n = 4) with Cngb1–/– dogs before and 3-months after subretinal AAV5-hGRK1-cCngb1 treatment (n = 7). Compared with before treatment, all mean a-wave responses were significantly improved (P < 0.05 and P < 0.01, 2-tailed, paired Student’s t test). The b-wave responses were also significantly improved (P < 0.05 to P <0.01, 2-tailed, paired Student’s t test), with the exception of the responses to the strongest stimuli (P = 0.052 and P = 0.054, 2-tailed, paired Student’s t test). (F and G) Duration of ERG rescue. Mean ± SD of scotopic b-wave in response to a stimulus of –2 log cds/m2 (F) and scotopic 5-Hz flicker at –1.6 log cds/m2 luminance (G), with time after injection. The gray bar represents the mean amplitude of untreated dogs ± 2 SD. Number of treated eyes at each time point: before treatment (0), 1, 2, and 3 months, n = 7;4 and 5 months, n = 4; 6, 7, and 9 months, n = 3; 12 and 18 months, n = 2. (H and I) Vision test results before versus 3 months after treatment. (H) Percentage of dogs that made the correct exit choice at each of 7 lighting levels. Pretreatment Cngb1–/– dogs made more exit choice errors at the dimmer light levels, and these dogs almost always chose correctly 3 months after gene augmentation. The improvement was significant at the lowest light intensity (P < 0.0001, 2-tailed, paired Student’s t test). (I) Time to exit. Prior to treatment, the Cngb1–/– dogs were slower to exit at the low light levels, and 3 months after treatment, the dogs were faster to exit at the low light levels. The difference was significant at the lowest light level (P < 0.001, 2-tailed, paired Student’s t test).
Figure 8
Figure 8. Retinal structure is preserved in gene therapy–treated retinal regions in Cngb1–/– dogs.
(A) SD-OCT cross-sectional images of the retinal region of an AAV5-hGRK1-cCgnb1–treated Cngb1–/– dog showing preservation of the retinal layers. In addition to ONL preservation, the ELM, EZ, and IZ appear to have better definition compared with untreated Cngb1–/– dogs. A WT control retina is shown for comparison. IR, inner retina; TR, total retina. (B) Plot of the mean thickness of the REC+ layer with age in Cngb1–/– treated retinae (n = 2) compared with Cngb1–/– untreated and unaffected dog retinae. The first time point of the Cngb1–/– measurement was 1 month after treatment. The untreated Cngb1–/– retina had a progressive, age-related decline in thickness. The treated eyes showed an initial decline in thickness of the REC+, like the untreated eyes, but then plateaued to remain significantly thicker than the REC+ layer of the untreated eye (P = 0.019, 2-tailed Student’s t test, 17–18 months of age). n = 3 untreated Cngb1–/– dogs. Data represent the mean ± SD. (C) FAF cSLO imaging of a treated eye 23 months after injection. The noninjected retinal region had a higher level of AF than did the treated (injected) region. Heatmap shows REC+ layer thickness preservation in the treated area of the same eye. (D) Cross-sectional SD-OCT images across the junction between injected and noninjected areas of the same eye as in C, showing a thinning of the ONL in the noninjected area (boundary is indicated by a white arrow). Also note the better definition of the ELM zone, the EZ, and the IZ zone on the image in the injected region. IHC image of the same region shows that Cngb1 expression stopped abruptly at the edge of the injected area (white arrow). Scale bars: 100 μm (A), 200 μm (D, top), and 100 μm (D, bottom).

References

    1. Hartong DT, Berson EL, Dryja TP. Retinitis pigmentosa. Lancet. 2006;368(9549):1795–1809. doi: 10.1016/S0140-6736(06)69740-7. - DOI - PubMed
    1. Daiger SP, Rossiter BJF, Greenberg J, Christoffels A, Hide W. Data services and software for identifying genes and mutations causing retinal degeneration. Invest Ophthalmol Vis Sci (Supp) 1998;39(4):S295
    1. Bainbridge JW, et al. Effect of gene therapy on visual function in Leber’s congenital amaurosis. N Engl J Med. 2008;358(21):2231–2239. doi: 10.1056/NEJMoa0802268. - DOI - PubMed
    1. Maguire AM, et al. Safety and efficacy of gene transfer for Leber’s congenital amaurosis. N Engl J Med. 2008;358(21):2240–2248. doi: 10.1056/NEJMoa0802315. - DOI - PMC - PubMed
    1. Hauswirth WW, et al. Treatment of leber congenital amaurosis due to RPE65 mutations by ocular subretinal injection of adeno-associated virus gene vector: short-term results of a phase I trial. Hum Gene Ther. 2008;19(10):979–990. doi: 10.1089/hum.2008.107. - DOI - PMC - PubMed

Publication types

Substances