. 2018 Jan 2;128(1):233-247.
doi: 10.1172/JCI95937. Epub 2017 Nov 27.

H3K27me3 dynamics dictate evolving uterine states in pregnancy and parturition

Affiliations

H3K27me3 dynamics dictate evolving uterine states in pregnancy and parturition

Patrice Nancy et al. J Clin Invest. .

Abstract

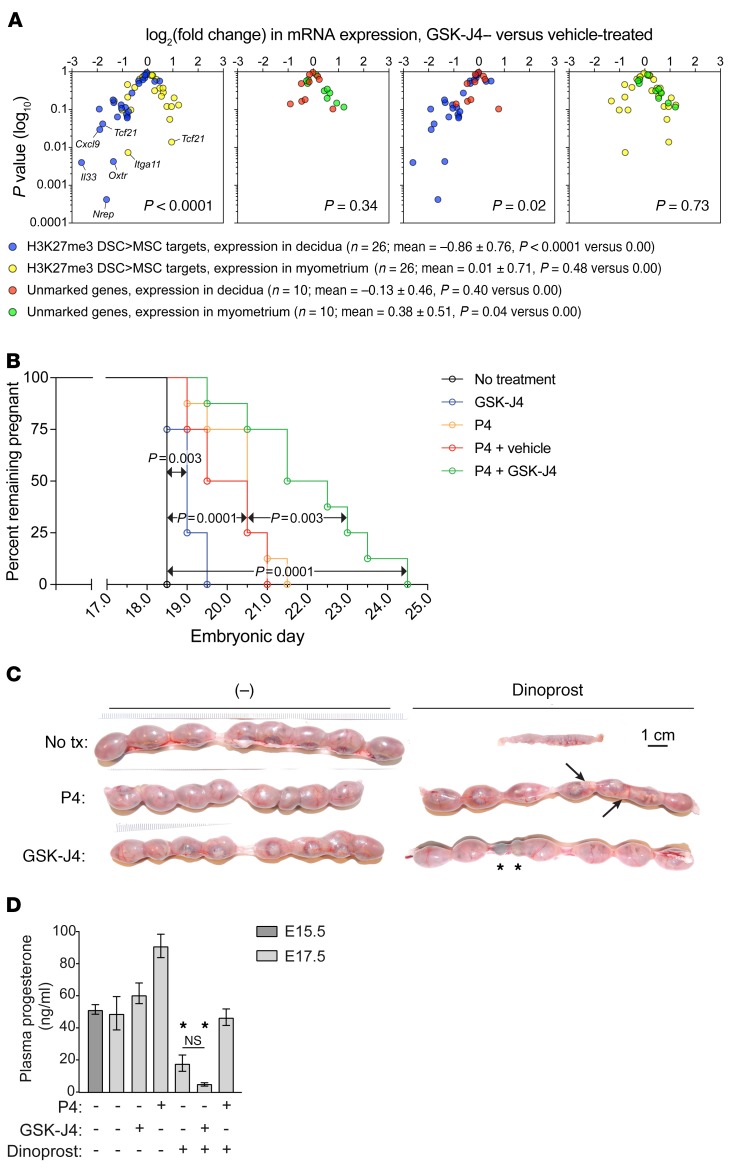
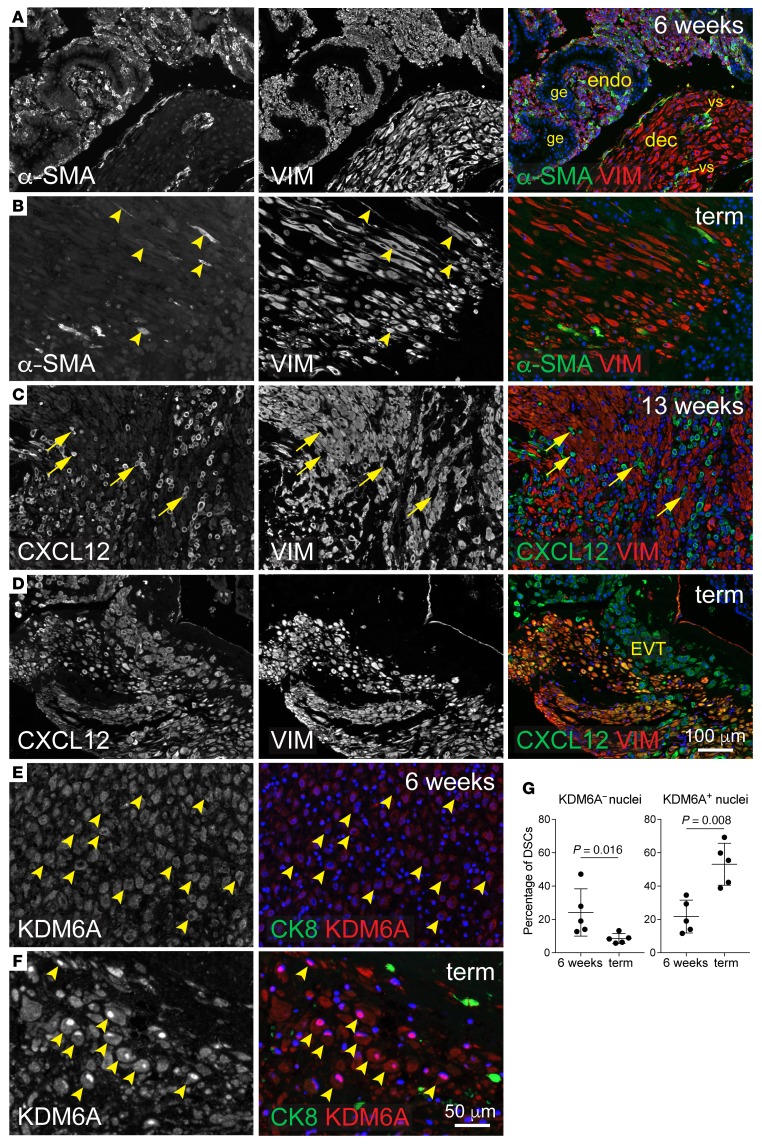
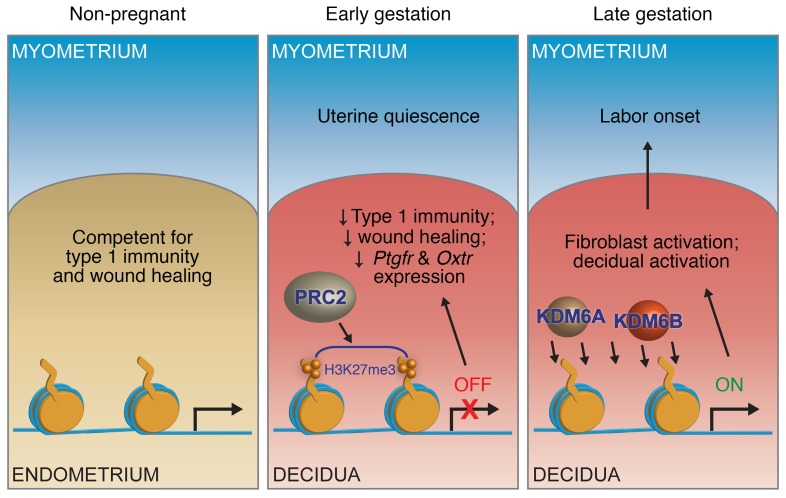
Uncovering the causes of pregnancy complications such as preterm labor requires greater insight into how the uterus remains in a noncontractile state until term and then surmounts this state to enter labor. Here, we show that dynamic generation and erasure of the repressive histone modification tri-methyl histone H3 lysine 27 (H3K27me3) in decidual stromal cells dictate both elements of pregnancy success in mice. In early gestation, H3K27me3-induced transcriptional silencing of select gene targets ensured uterine quiescence by preventing the decidua from expressing parturition-inducing hormone receptors, manifesting type 1 immunity, and most unexpectedly, generating myofibroblasts and associated wound-healing responses. In late gestation, genome-wide H3K27 demethylation allowed for target gene upregulation, decidual activation, and labor entry. Pharmacological inhibition of H3K27 demethylation in late gestation not only prevented term parturition, but also inhibited delivery while maintaining pup viability in a noninflammatory model of preterm parturition. Immunofluorescence analysis of human specimens suggested that similar regulatory events might occur in the human decidua. Together, these results reveal the centrality of regulated gene silencing in the uterine adaptation to pregnancy and suggest new areas in the study and treatment of pregnancy disorders.

Keywords: Epigenetics; Fibrosis; Obstetrics/gynecology; Reproductive Biology.


Conflict of interest statement

Conflict of interest: The authors have declared that no conflict of interest exists.

Figures

Figure 1
Figure 1. H3K27me3 generation in the postimplantation uterus.
(A and B) Schematics of ChIP-Seq comparisons. We considered only peaks that overlapped or were less than 5 kb upstream of the TSS (4,504 total). Stromal cells (DSCs, MSCs) were cultured for 24 hours after purification from artificially decidualized uteri (an abundant source of cells) on the day corresponding to E7.5. Comparisons between these cells (A; n = 3 each) tallied peaks that were significantly enriched more than 2-fold between populations (FDR < 0.05). Comparisons between whole tissues and tissue layers (B; n = 3 decidua and interimplantation site samples, n = 2 myometrium samples, all from true pregnancies on E7.5) employed the same overall peak set but, in consideration of the nonstromal cell contributions to the extracts, tallied those peaks with significantly different concentrations regardless of the degree of difference. (C, E, and F) Venn diagrams indicating the overlap between various peak sets. (D) Absolute concentrations of DSC>MSC peaks in stromal cell and whole-tissue layer extracts (mean ± SEM). Significant differences are indicated (unpaired t test). The lower concentration of peaks unique to the DSC>MSC data set brought their average concentration in decidual extracts into proximity with their average concentration in the whole-tissue myometrial extracts (red bar), which was not reduced in parallel. This precluded their scoring as enriched between tissue layers. Similar considerations applied to MSC>DSC peaks, which nonetheless already showed 60% overlap with myo>dec peaks (E, Supplemental Figure 1C). (GJ) EZH2 immunostaining of peri-implantation uteri. On E3.5 and in E6.5 interimplantation sites, EZH2 was expressed at low or undetectable levels by ESCs (G and H), whereas on E5.5 (not shown) and E6.5 (I), it was strongly expressed in most DSCs. Panels GI are shown at the same magnification. Panel J is a close-up of panel I; note the nuclear accumulation of EZH2 in a large fraction of DSCs. CK8 identifies uterine epithelial cells and trophoblasts. DAPI counterstain. myo, myometrium; endo, endometrium; dec, decidua; e, embryo.
Figure 2
Figure 2. H3K27me3 accrual in DSCs attenuates type 1 immunity in the decidua.
(A) H3K27me3 tracks at the Cxcl9, Cxcl10, Cxcl12, Cxcl16, and Csf1 loci. The tracks are the pileups of the 3 independent replicates. The log2 concentration for each called peak and the TSS with direction of transcription (arrow) are indicated. Sequencing reads from total input chromatin were homogeneous across these loci (not shown). (BJ) H3K27me3 silences Csf1 in DSCs, limiting macrophage accumulation in the decidua. (BD) Immunostaining for F4/80+ macrophages (red) in the undecidualized E3.5 uterus 1 day prior to implantation (B), an interimplantation site on E6.5 (C), and an E6.5 implantation site (D). Note the dramatically lower tissue density of macrophages within the decidua as compared with the undecidualized endometrium, consistent with previous results at later gestation (9). Representative images from 3 mice/group; panels C and D show sections near those in Figure 1, H and I, respectively. (E) qRT-PCR determination of Csf1 mRNA expression in stromal cells isolated from E7.5 pregnant mice and cultured for 24 hours (mean ± SEM; n = 3 samples/group). DSCs express lower levels of Csf1 than MSCs, at least in part explaining the lower level of Csf1 expression in the whole decidua (9). (FJ) Effect of ectopic CSF-1 expression within the decidua. Artificially decidualized uteri were injected with Csf1-expressing or empty vector control lentivirus on the day corresponding to E5.5 and the mice were sacrificed 2 days later. Viral preparations included aliquots of EGFP reporter lentiviruses to identify transduced areas. Representative images of serial sections immunostained for F4/80 or GFP (FI) and mean ± SEM of quantified F4/80+ cell densities in infected (GFP+) and uninfected (GFP) decidual areas (J) from 4 control virus–infected mice and 5 Csf1 virus–infected mice. Note that decidual areas infected with Csf1-expressing lentiviruses accumulate macrophages, demonstrating a CSF-1 deficit within this tissue layer. Asterisk indicates decidual lumen.
Figure 3
Figure 3. H3K27me3 accrual in DSCs prevents fibroblast activation/myofibroblast formation and wound healing in the decidua.
(AC) RNA-Seq analysis of DSCs, MSCs, and USCs, and the relationship of gene expression to H3K27me3 marking. Distribution of mRNA expression differences (Padj < 0.05; n = 3 samples/group), binned into progressive 2-fold changes. *P < 5.6 × 10⁻³, significantly over- (orange) or underrepresented (gray) for DSC>MSC targets as compared with expectation. (D) DSC>MSC H3K27me3 targets within all genes with significantly different expression both between MSCs and USCs and between DSCs and USCs. (E) H3K27me3 marking and mRNA expression of DSC>MSC targets involved in fibroblast activation/myofibroblast formation. The 15 genes with rankings are from the upper left quadrant of D and encode the classical markers FAP (12), CXCL12 (12), THY1 (14), and PDGFRB (12), proteins with less extensive literature such as IGFBP-5 (45), C-type natriuretic peptide (46), P311 (13), CXCL16 (47), integrin α11 (13), PAR2 (48), TRPC3 (49), and IL-33 (50), and several Wnt-signaling regulators induced during fibrosis or themselves profibrotic (13, 51). Although their expression was not increased in MSCs compared with USCs, other DSC>MSC targets included Acta2 (α-SMA) (13) and Cspg6 (14), 2 other major myofibroblast markers, as well as Agtr1a (14), Irf5, Pdpn (12), Tcf21 (14), Trpc6 (14), and Zeb1 (12), encoding additional emerging markers or inducers (bottom set). (FI) Impaired wound healing responses in the decidua. Paired horns of undecidualized uteri were left unmanipulated (F) or scratched along their inner surface with a needle (G). Note the autofluorescent RBCs at the wound site (arrow). Representative images from 5 mice. Artificial decidua were wounded via injection with EGFP-expressing lentiviruses. Note the extravascular RBCs but minimal α-SMA staining at an injection site (H); the nearby myometrium was α-SMA+ (I). Representative images from 52 injection sites from 4 mice. Mice were sacrificed 2 days after scratching/injection.
Figure 4
Figure 4. H3K27 demethylation in late-gestation DSCs, associated with gene upregulation.
RNA-Seq (A and F) and ChIP-Seq (B and F) were performed on purified cells cultured for 24 hours (n = 3 samples/group). (A) RNA-Seq analysis of various H3K27me3 DSC>MSC targets and inducible inflammatory targets. Other genes of interest are also shown. (B) Distribution of H3K27me3 ±5 kb around the TSS of DSC>MSC targets. Replicates are shown. (C and D) Representative Western blots (C) and normalized H3K27me3:total H3 levels (D) of cells isolated from E15.5 mice injected daily with GSK-J4 or vehicle (–) from E13.5 and cultured for 24 hours (mean ± SEM of n = 4 samples/group; 2 sets of blots). For each set, the average H3K27me3/total H3 ratio for the MSC samples from vehicle-treated mice was set to 1.0 (P = 0.0004, 1-way ANOVA; *P = 0.012; **P < 0.001). Of note, E15.5 DSCs contained less total H3 than MSCs; GSK-J4 had no effect on levels of H3K9me3, another repressive histone mark (Supplemental Figure 6, C–G). (E) H3K27me3 demethylase activity measured on nuclear extracts of whole tissue or tissue layers (mean ±S EM; n = 3 mice/group). The spike in activity in the E15.5 decidua was significantly different from all other groups (P < 0.0001, 1-way ANOVA; *P < 0.05 compared with all other groups). (F) Relationship between H3K27me3 status in DSCs and gene-expression changes (mean ± SEM; n = 3 samples/group). Significantly different DSC groups are indicated (P < 0.0001, 1-way ANOVA; ****P < 0.0001 compared with all other DSC groups). Genes with undetectable H3K27me3 on E7.5 showed no average expression change from E7.5 to E15.5, as did genes for which H3K27me3, while detectable, was either insignificantly changed or reduced less than 1.5 log2–fold. In contrast, greater degrees of H3K27me3 loss correlated with increasingly greater degrees of upregulation. This pattern was not evident for MSCs. Each DSC group was significantly different from its respective MSC group (P < 0.0001, paired t test).
Figure 5
Figure 5. Effect of GSK-J4 on late-gestation pregnancy and parturition.
Mice were injected daily with GSK-J4 or vehicle starting on E13.5. (A) qRT-PCR analysis of mRNA expression in dissected decidual and myometrial tissue layers on E17.5, with log2(fold change) between GSK-J4– and vehicle-treated mice displayed on volcano plots (n = 6 mice/group). Genes affected by GSK-J4 (P < 0.05) are indicated. Supplemental Figure 7, A–C, shows individual gene-expression levels; the unmarked genes encode epigenetic modifiers, tissue layer–specific markers, and Pgr. The symbol key lists mean log2(fold change) ± SD for each group and the P value of its comparison to 0.00 by 1-sample t test. Groups were compared with each other by 1-way ANOVA (P < 0.0001) followed by Sidak’s multiple comparison test (P values shown in each plot). (B) Effects of GSK-J4 and P4 on delivery time (n = 8 mice/group); P values were determined by the log-rank (Mantel-Cox) test. (C) Effect of GSK-J4 on dinoprost-induced preterm delivery. Mice were injected with dinoprost and/or P4 on E16.5. Representative images from 6–8 mice/group. Injection of E16.5 pregnant mice with dinoprost unfailingly induced delivery within 24 hours (0/7 mice remained pregnant), 1 day before term. None of the delivered pups were viable. While P4 cotreatment prevented early delivery in all cases (6/6), only 27% of the fetuses were viable. Arrows indicate 2 pale, dead fetuses. In contrast, GSK-J4 cotreatment both prevented delivery (7/7 mice pregnant; P = 0.0006 compared with dinoprost alone, Fisher’s exact test) and maintained pup viability (86%; P < 0.0001 compared with dinoprost plus P4, Fisher’s exact test). Asterisks indicate implantation sites that had resorbed earlier in gestation. (D) Plasma P4 levels (mean ± SEM; n = 3 mice/group). GSK-J4/dinoprost–treated mice had low plasma P4 (P < 0.0001, 1-way ANOVA; *P < 0.0001) and thus had undergone luteolysis; presumably, they would soon enter labor. Supplemental Table 7 shows a full accounting of the experiments in panels B and C.
Figure 6
Figure 6. Expression of fibroblast activation markers and KDM6A in the pregnant human uterus.
Images are representative of 5 specimens per time point. Specimens at 6 and 13 weeks were from elective terminations. Vimentin (VIM) was used as an ESC/DSC marker. DAPI counterstain (blue). (A and B) α-SMA/VIM staining. At 6 weeks (A), fields of small VIM+ cells associated with extensive glandular epithelium (ge) identify areas of undecidualized endometrium. α-SMA+ cells within decidualized areas at 6 (A) and 13 weeks (Supplemental Figure 8B) were invariably associated with vascular structures (vs) and thus were vascular smooth muscle cells. (C and D) CXCL12/VIM staining. Note the absence of CXCL12 expression in DSCs at 13 weeks, which contrasts with interspersed CXCL12+VIM cells (C, arrows). Neighboring sections revealed these VIM cells to be positive for CK7 and CK8 (not shown and Supplemental Figure 8A), identifying them as extravillous trophoblasts (EVT) and confirming their expression of CXCL12 described previously (52). At term, all DSCs expressed substantial CXCL12 levels that were similar to those of neighboring trophoblasts (D). (E and F) KDM6A/CK8 staining; higher magnification. At 6 weeks, KDM6A staining in DSCs (identified morphologically and by their CK8 negativity) was frequently nonnuclear, whereas at term it was predominantly nuclear. Respective examples of both cases are indicated (arrowheads). Of note, we could not rule out the possibility that the cytoplasmic staining was nonspecific. If so, this would mean that the nuclear accumulation at term reflected new KDM6A synthesis; otherwise, it might in part reflect nuclear shuttling, as described previously for KDM6B (53). (G) Quantification of KDM6A distribution. Cells were scored as having KDM6A or KDM6A+ nuclei based upon their nuclear-to-cytoplasmic staining ratio. n = 84–380 cells over at least 3 fields were scored per specimen. Error bars indicate SD. P values were determined by 2-tailed Mann-Whitney U test.
Figure 7
Figure 7. Proposed model for the role of H3K27me3 dynamics in pregnancy and parturition.
In early gestation, target gene accrual of H3K27me3 in DSCs inhibits the expression of genes that would otherwise promote uterine contractility and thus PTL; in late gestation, genome-wide H3K27 demethylation in DSCs, mediated by KDM6A and KDM6B, leads to target gene reexpression and decidual/fibroblast activation and thus in turn the generation of signals that promote myometrial contractility and labor entry.

Similar articles

Cited by

References

    1. Cha J, Sun X, Dey SK. Mechanisms of implantation: strategies for successful pregnancy. Nat Med. 2012;18(12):1754–1767. doi: 10.1038/nm.3012. - DOI - PMC - PubMed
    1. Shynlova O, Lee YH, Srikhajon K, Lye SJ. Physiologic uterine inflammation and labor onset: integration of endocrine and mechanical signals. Reprod Sci. 2013;20(2):154–167. doi: 10.1177/1933719112446084. - DOI - PubMed
    1. Norwitz ER, et al. Molecular regulation of parturition: the role of the decidual clock. Cold Spring Harb Perspect Med. 2015;5(11):a023143. doi: 10.1101/cshperspect.a023143. - DOI - PMC - PubMed
    1. Romero R, Dey SK, Fisher SJ. Preterm labor: one syndrome, many causes. Science. 2014;345(6198):760–765. doi: 10.1126/science.1251816. - DOI - PMC - PubMed
    1. Muglia LJ, Katz M. The enigma of spontaneous preterm birth. N Engl J Med. 2010;362(6):529–535. doi: 10.1056/NEJMra0904308. - DOI - PubMed

Publication types