. 2018 Jan 2;128(1):309-322.
doi: 10.1172/JCI89333. Epub 2017 Nov 27.

Hyposialylated IgG activates endothelial IgG receptor FcγRIIB to promote obesity-induced insulin resistance

Affiliations

Hyposialylated IgG activates endothelial IgG receptor FcγRIIB to promote obesity-induced insulin resistance

Keiji Tanigaki et al. J Clin Invest. .

Abstract

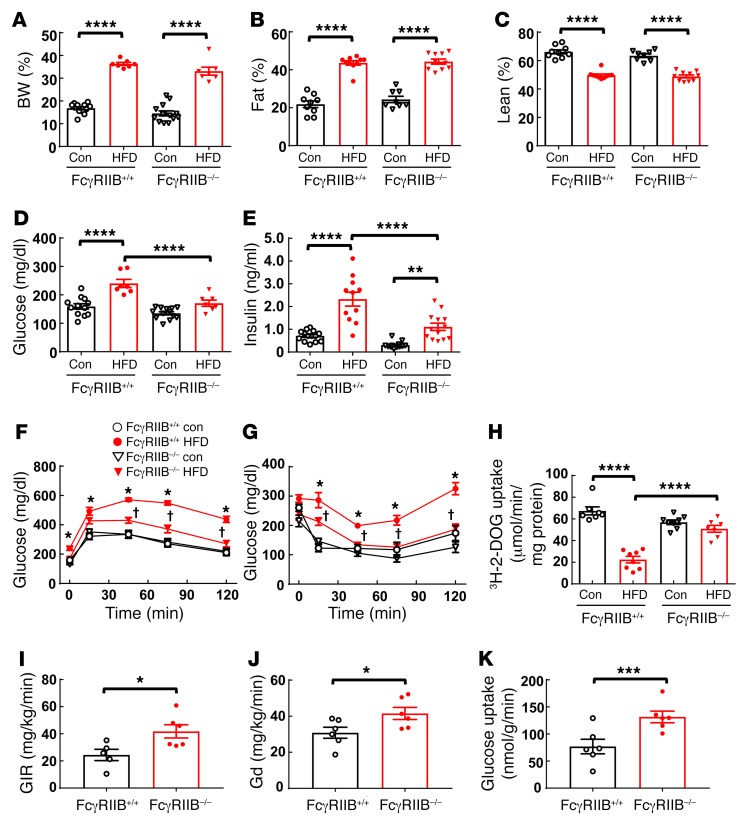
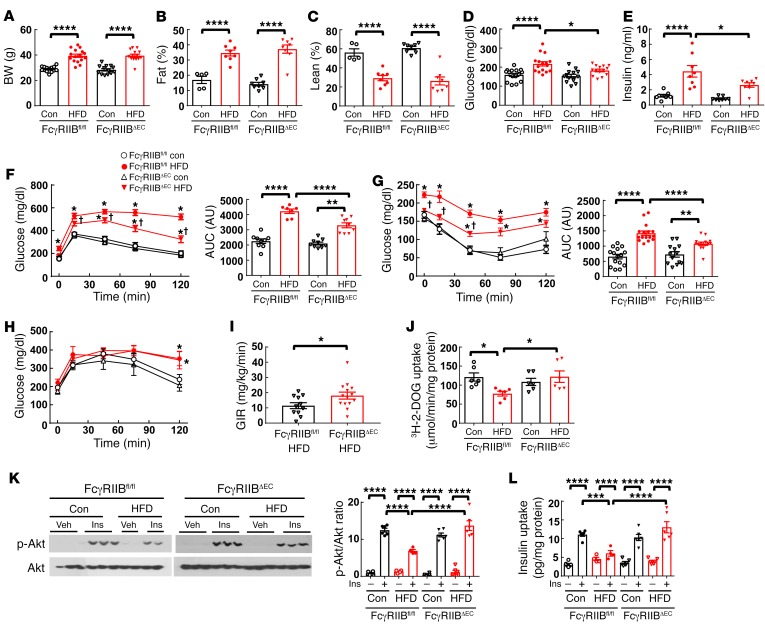
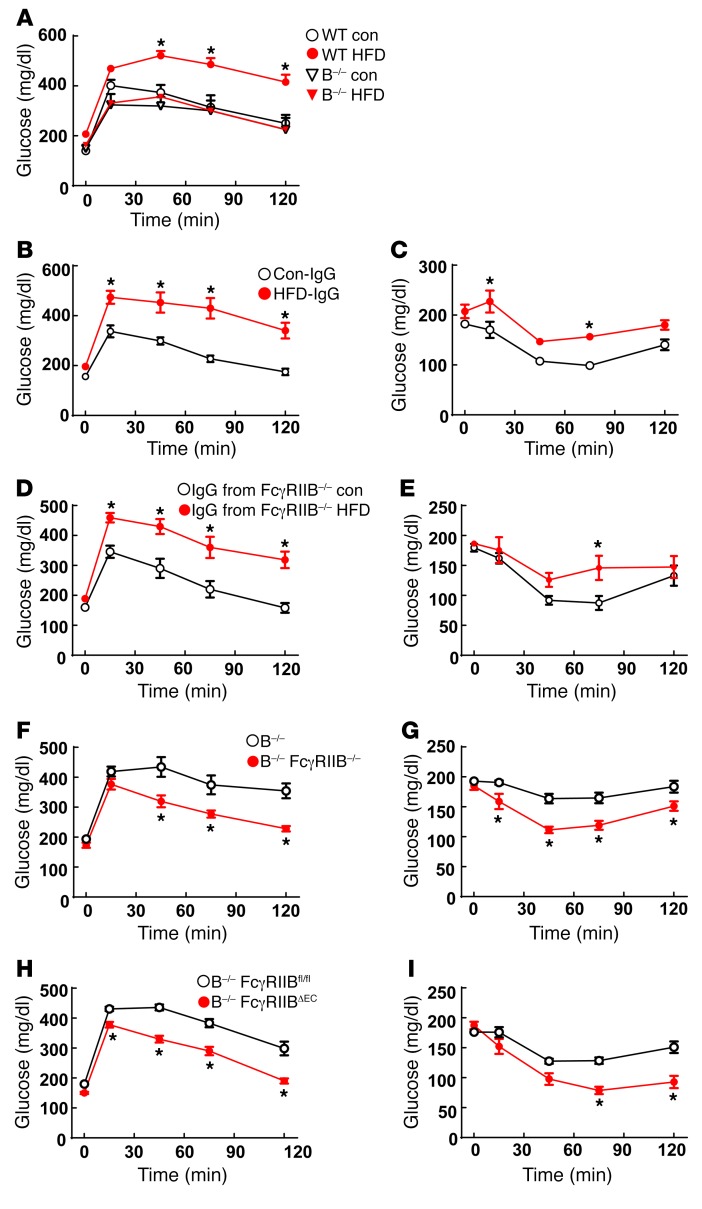
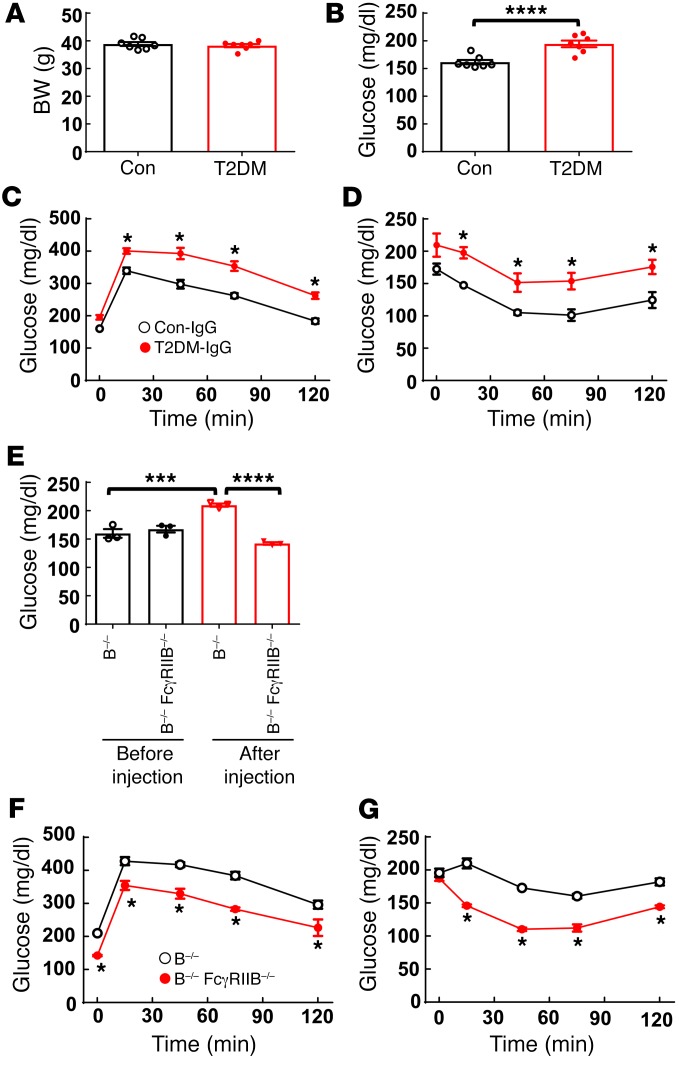
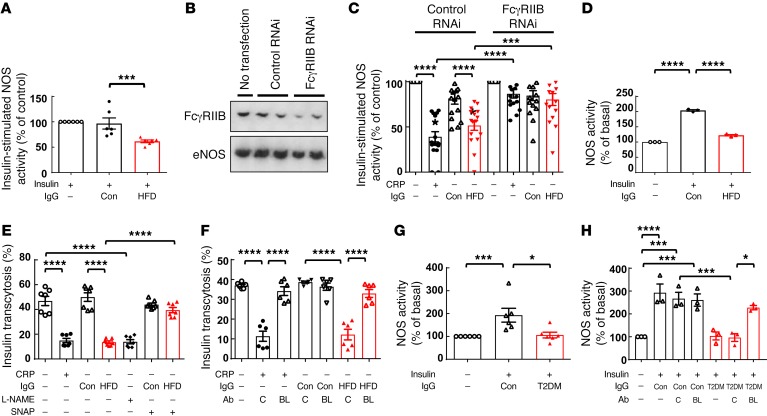
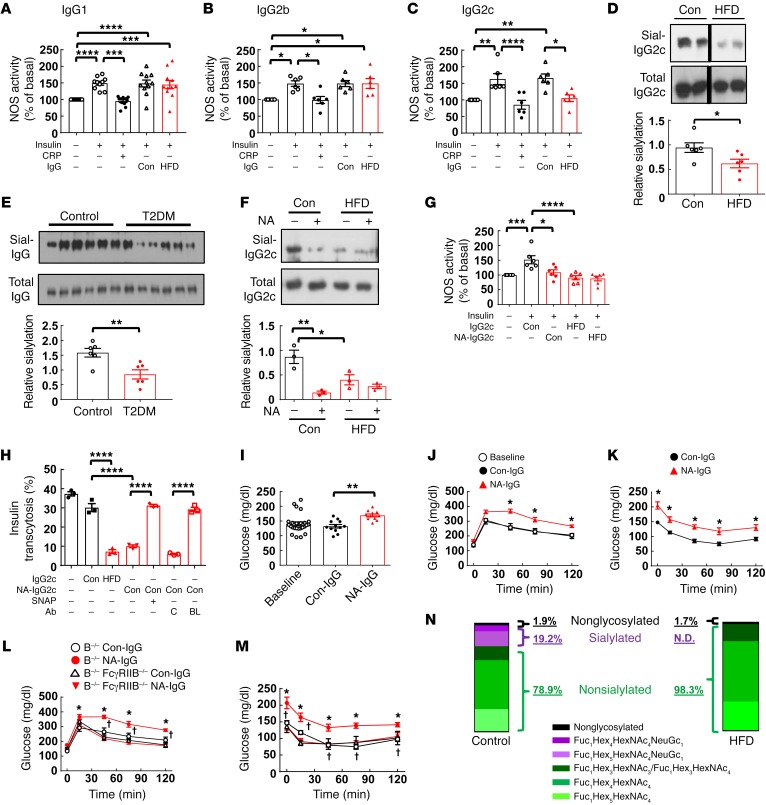
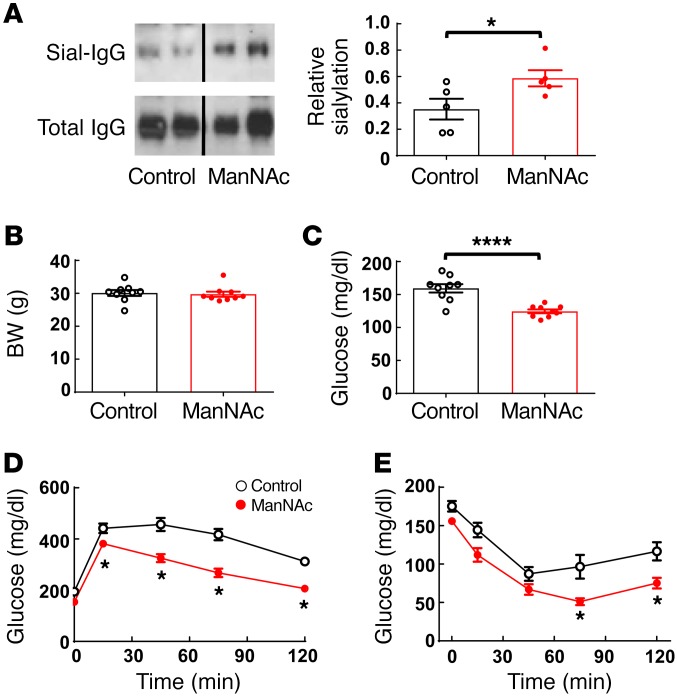
Type 2 diabetes mellitus (T2DM) is a common complication of obesity. Here, we have shown that activation of the IgG receptor FcγRIIB in endothelium by hyposialylated IgG plays an important role in obesity-induced insulin resistance. Despite becoming obese on a high-fat diet (HFD), mice lacking FcγRIIB globally or selectively in endothelium were protected from insulin resistance as a result of the preservation of insulin delivery to skeletal muscle and resulting maintenance of muscle glucose disposal. IgG transfer in IgG-deficient mice implicated IgG as the pathogenetic ligand for endothelial FcγRIIB in obesity-induced insulin resistance. Moreover, IgG transferred from patients with T2DM but not from metabolically healthy subjects caused insulin resistance in IgG-deficient mice via FcγRIIB, indicating that similar processes may be operative in T2DM in humans. Mechanistically, the activation of FcγRIIB by IgG from obese mice impaired endothelial cell insulin transcytosis in culture and in vivo. These effects were attributed to hyposialylation of the Fc glycan, and IgG from T2DM patients was also hyposialylated. In HFD-fed mice, supplementation with the sialic acid precursor N-acetyl-D-mannosamine restored IgG sialylation and preserved insulin sensitivity without affecting weight gain. Thus, IgG sialylation and endothelial FcγRIIB may represent promising therapeutic targets to sever the link between obesity and T2DM.

Keywords: Metabolism; Mouse models; Obesity; Vascular Biology; endothelial cells.


Conflict of interest statement

Conflict of interest: The authors have declared that no conflict of interest exists.

Figures

Figure 1
Figure 1. FcγRIIB–/– mice are protected from obesity-induced glucose intolerance and insulin resistance.
Beginning at 5 weeks of age, male FcγRIIB+/+ and FcγRIIB–/– mice were fed a control diet (Con) or a HFD for 12 weeks, and BW (A) and fat and lean mass (B and C) were evaluated. Fasting blood glucose (D) and insulin (E) levels were measured (n = 7–13), and a GTT (F) was performed. Following a 1-week recovery while continuing the assigned diets, the mice were fasted, and an ITT (G) was performed. (F and G) n = 6–13. *P < 0.05 versus FcγRIIB+/+ control; P < 0.05 versus FcγRIIB+/+ HFD. (H) Following another week of recovery, the mice were fasted, and [3H]-2-deoxyglucose (3H-2-DOG) uptake in skeletal muscle was measured. n = 7–8. (IK) Euglycemic-insulinemic clamps were performed on mice on a HFD, and the GIR (I), peripheral Gd (J), and skeletal glucose uptake (K) were evaluated. n = 5–6. Values represent the mean ± SEM. *P < 0.05, **P < 0.01, ***P < 0.005, and ****P < 0.001, by 1-way ANOVA with Tukey’s post-hoc test (AE and H), 2-way ANOVA with Tukey’s post-hoc test (F and G), and Student’s t test (IK).
Figure 2
Figure 2. Mice with endothelium-specific deletion of FcγRIIB (FcγRIIBΔEC) are protected from obesity-induced glucose intolerance and insulin resistance due to the preservation of skeletal muscle insulin delivery, insulin action, and glucose uptake.
(AC) Male FcγRIIBfl/fl and FcγRIIBΔEC mice were fed a control diet or a HFD for 12 weeks, and BW (A) and fat and lean mass (B and C) were evaluated. n = 5–13 (AC). Fasting blood glucose (D) and insulin (E) levels were measured (n = 8–16), and a GTT (F; right panel shows the AUC) was performed. An ITT (G; right panel shows the AUC) and a PTT (H) were then performed, each following a 1-week recovery while mice continued the assigned diets. (FH) n = 6–13. (I) In separate mice, following 12 weeks on a HFD, a hyperinsulinemic-euglycemic clamp was performed, and the GIR was calculated. n = 11–14. (J) One week after the PTT, the mice in AH were fasted, and [3H]-2-deoxyglucose uptake in skeletal muscle was measured. n = 7–8. (FH) *P < 0.05 versus FcγRIIB+/+ control diet; †P < 0.05 versus FcγRIIB+/+ HFD. (K and L) Following 12 weeks on a control diet or a HFD, mice were fasted and i.v. injected with PBS (Veh) or insulin (Ins) (1 unit/kg BW), and 5 minutes later, skeletal muscle was harvested, the phosphorylation of Akt (Ser473) was assessed by immunoblotting (K), and muscle insulin content was measured by ELISA (L). (K and L) n = 4–6. Values represent the mean ± SEM. *P < 0.05, **P < 0.01, ***P < 0.005, and ****P < 0.001, by 1-way ANOVA with Tukey’s post-hoc test (AE, and IL), 2-way ANOVA with Tukey’s post-hoc test (FH), and Student’s t test (I).
Figure 3
Figure 3. IgG isolated from HFD-fed WT mice induces glucose intolerance and insulin resistance in B–/– mice via endothelial FcγRIIB.
(A) Male WT or B–/– mice were fed a control diet or a HFD for 12 weeks, and a GTT was performed. n = 7–9. *P < 0.05 versus WT control. (B and C) Male B–/– mice were fed a HFD for 12 weeks, and while continuing the HFD, they were i.p. injected with IgG (150 μg/mouse, 2 times/week) isolated from WT mice fed either a control diet (Con-IgG) or a HFD (HFD-IgG). GTTs (B) and ITTs (C) were performed after 1 week and 2 weeks of IgG administration, respectively. (B and C) n = 6–7. *P < 0.05 versus Con-IgG. (D and E) Using the study design and readouts described for B and C, IgG transfer experiments were performed in male B–/– mice given IgG isolated from FcγRIIB–/– mice fed either a control diet or a HFD. Endpoints were the GTT (D) and ITT (E). (D and E) n = 6–7. *P < 0.05 versus IgG from FcγRIIB–/– control mice. (F and G) IgG transfer studies were performed in male B–/– versus B–/– FcγRIIB–/– mice administered IgG isolated from HFD-fed WT mice. GTTs (F) and ITTs (G) were performed. (F and G) n = 7–8. *P < 0.05 versus B–/– mice. (H and I) IgG transfer experiments were performed in male B–/– FcγRIIBfl/fl and B–/– FcγRIIBΔEC mice administered IgG isolated from HFD-fed WT mice. GTTs (H) and ITTs (I) were performed. (H and I) n = 11–14. *P < 0.05 versus B–/– FcγRIIBfl/fl mice. Values represent the mean ± SEM. P values were determined by 2-way ANOVA with Tukey’s post-hoc test.
Figure 4
Figure 4. IgG isolated from human T2DM patients induces glucose intolerance and insulin resistance in B–/– mice via FcγRIIB.
(AD) Male B–/– mice were fed a HFD for 12 weeks, and while continuing the HFD, they were i.p. injected with IgG (150 μg/mouse, 2 times/week) isolated from non-T2DM control subjects versus IgG from T2DM subjects. After 1 week of injections, (A) BW was measured, (B) plasma glucose was measured after a 4- to 6-hour fast, and (C) a GTT was performed. (D) An ITT was performed following a second week of IgG injections. (AD) n = 6 IgG samples, each evaluated in 3 to 5 mice. (C and D) *P < 0.05 versus Con-IgG. (EG) Using the study design described for AD, IgG transfer experiments were performed by administering human T2DM-IgG to male B–/– mice and B–/– FcγRIIB–/– mice. (E) Fasting plasma glucose levels were measured before IgG injection and at 1 week. n = 3 IgG samples. (F) A GTT was performed after 1 week of injections, and (G) an ITT was performed after 2 weeks of injections. (F and G) n = 3 IgG samples. *P < 0.05 versus B–/–. Values represent the mean ± SEM. *P < 0.05, ***P < 0.005, ****P < 0.001, by Student’s t test (A and B, with significance found in B), 1-way ANOVA with Tukey’s post-hoc test (E), and 2-way ANOVA with Tukey’s post-hoc test (C, D, F, and G).
Figure 5
Figure 5. IgG from HFD-fed mice attenuates insulin-induced eNOS activation and transendothelial transport of insulin via FcγRIIB and eNOS antagonism, and IgG from T2DM subjects blunts insulin action in human endothelium via FcγRIIB.
(A) BAECs were preincubated for 30 minutes with IgG isolated from control diet–fed (Con-IgG) or HFD-fed (HFD-IgG, 10 μg/ml) mice, and eNOS activity stimulated by insulin (100 nM) was measured. n = 6. (B and C) BAECs were transfected with or without control RNAi or RNAi targeting FcγRIIB. Downregulation of FcγRIIB was assessed by immunoblotting (B) using anti-FcγRIIB or anti-eNOS antibody to evaluate protein loading. (C) Forty-eight hours after transfection, cells were pretreated with CRP (25 μg/ml), Con-IgG, or HFD-IgG (10 μg/ml) for thirty minutes, and eNOS activity stimulated by insulin was measured. n = 16. (D) HAECs were preincubated with Con-IgG or HFD-IgG (10 μg/ml), and eNOS activity under basal conditions or with insulin treatment was measured. n = 3. (E) Confluent HAEC monolayers on Transwells were preincubated for 30 minutes with CRP, Con-IgG, or HFD-IgG in the absence or presence of the NOS inhibitor L-NAME (2 mM) or the NO donor SNAP (100 nM). FITC-conjugated insulin (50 nM) was added to the upper chamber, and the amount of insulin transcytosed to the lower chamber was evaluated after 2 hours. n = 7. (F) Using the study design and methods described for E, endothelial cell insulin transcytosis was evaluated without versus with CRP, Con-IgG, or HFD-IgG treatment, in the presence of subtype-matched control antibody (C, 10 μg/ml) or the FcγRIIB-blocking antibody AT10 (BL, 10 μg/ml). n = 6. (G) Insulin-induced eNOS activation was evaluated in HAECs with or without treatment with IgG from nondiabetic individuals (Con) or T2DM patients. n = 6. (H) Additional NOS activity assays were performed in the presence of the subtype-matched control antibody (C) or the FcγRIIB-blocking antibody (BL). n = 3. Values represent the mean ± SEM. *P < 0.05, ***P < 0.005, and ****P < 0.001, by 1-way ANOVA with Tukey’s post-hoc test.
Figure 6
Figure 6. Hyposialylated IgG2c from HFD-fed mice blunts endothelial insulin transcytosis and invokes insulin resistance via FcγRIIB, and IgG from T2DM subjects is similarly hyposialylated.
(AC) The effects of the IgG subclasses IgG1 (A), IgG2b (B), or IgG2c (C) (10 μg/ml) from control diet– or HFD-fed WT mice on eNOS activation by insulin (100 nM) were assessed in cultured endothelial cells. (AC) n = 6–11. (D) Sialylation of IgG2c (Sial-IgG2c) from control diet– or HFD-fed mice was evaluated by SNA-lectin blotting. n = 6. (E) Sialylation of IgG isolated from nondiabetic humans and T2DM patients was evaluated by SNA-lectin blotting. n = 6. (F) IgG2c from control diet– or HFD-fed mice was treated with vehicle (Con) or NA, and sialylation was evaluated by SNA-lectin blotting. n = 3. (G) Endothelial cells were preincubated with Con-IgG2c or HFD-IgG2c treated with vehicle or NA, and eNOS activation by insulin was assessed. n = 6. (H) Confluent endothelial cells on Transwells were preincubated with Con-IgG2c or HFD-IgG2c treated with vehicle or NA, and insulin transcytosis was assessed in the absence or presence of the NO donor SNAP (100 nM), control antibody (C, 10 μg/ml), or FcγRIIB-blocking antibody (BL, 10 μg/ml). n = 7. (IK) B–/– mice were fed a HFD for 12 weeks and injected with Con-IgG that was treated ex vivo with vehicle (Con-IgG) or NA (NA-IgG). Fasting plasma glucose was measured before and after 1 week of injections (I), and then GTTs (J) and ITTs (K) were performed. (IK) n = 7–16. *P < 0.05, NA versus Con-IgG. (L and M) Using the same study design as in IK, IgG transfer experiments were performed in B–/– and B–/– FcγRIIB–/– mice administered Con-IgG or NA-IgG. GTTs (L) and ITTs (M) were performed. (L and M) n = 5–6. *P < 0.05, B–/– NA-IgG versus B–/– Con-IgG; †P < 0.05, B–/– FcγRIIB–/– versus B–/–. (N) The Fc Asn297–associated glycan structure was evaluated by glycoproteomic analysis using pooled mouse Con-IgG2c and HFD-IgG2c. Values represent the mean ± SEM (AM). *P < 0.05, **P < 0.01, ***P < 0.005, and ****P < 0.001, by 1-way ANOVA with Tukey’s post-hoc test (AC and FI), Student’s t test (D and E), and 2-way ANOVA (JM).
Figure 7
Figure 7. ManNAc treatment protects mice from obesity-induced glucose intolerance and insulin resistance.
(A) Male WT mice were fed a HFD and either regular drinking water (control) or ManNAc-supplemented drinking water for 6 weeks. Plasma IgG was isolated, and its sialylation was evaluated by SNA-lectin blotting. Graph depicts the relative sialylation. n = 5. (B) BW and (C) fasting plasma glucose levels were measured, and (D) a GTT was performed. (E) Mice were continued on the HFD, and an ITT was performed 1 week later. n = 9. (AE) Values represent the mean ± SEM. (AC) *P < 0.05 and ****P < 0.001, by Student’s t test; (D and E) *P < 0.05, ManNAc versus control, by 2-way ANOVA with Tukey’s post-hoc test.

Similar articles

Cited by

References

    1. Seuring T, Archangelidi O, Suhrcke M. The Economic Costs of Type 2 Diabetes: A Global Systematic Review. Pharmacoeconomics. 2015;33(8):811–831. doi: 10.1007/s40273-015-0268-9. - DOI - PMC - PubMed
    1. Global Burden of Metabolic Risk Factors for Chronic Diseases Collaboration Cardiovascular disease, chronic kidney disease, and diabetes mortality burden of cardiometabolic risk factors from 1980 to 2010: a comparative risk assessment. Lancet Diabetes Endocrinol. 2014;2(8):634–647. doi: 10.1016/S2213-8587(14)70102-0. - DOI - PMC - PubMed
    1. NCD Risk Factor Collaboration (NCD-RisC) Worldwide trends in diabetes since 1980: a pooled analysis of 751 population-based studies with 4.4 million participants. Lancet. 2016;387(10027):1513–1530. doi: 10.1016/S0140-6736(16)00618-8. - DOI - PMC - PubMed
    1. Després JP, Lemieux I. Abdominal obesity and metabolic syndrome. Nature. 2006;444(7121):881–887. doi: 10.1038/nature05488. - DOI - PubMed
    1. Danaei G, et al. National, regional, and global trends in fasting plasma glucose and diabetes prevalence since 1980: systematic analysis of health examination surveys and epidemiological studies with 370 country-years and 2·7 million participants. Lancet. 2011;378(9785):31–40. doi: 10.1016/S0140-6736(11)60679-X. - DOI - PubMed

Publication types