. 2018 Jan 2;128(1):402-414.
doi: 10.1172/JCI93597. Epub 2017 Dec 4.

Stromal Lkb1 deficiency leads to gastrointestinal tumorigenesis involving the IL-11-JAK/STAT3 pathway

Affiliations

Stromal Lkb1 deficiency leads to gastrointestinal tumorigenesis involving the IL-11-JAK/STAT3 pathway

Saara Ollila et al. J Clin Invest. .

Abstract

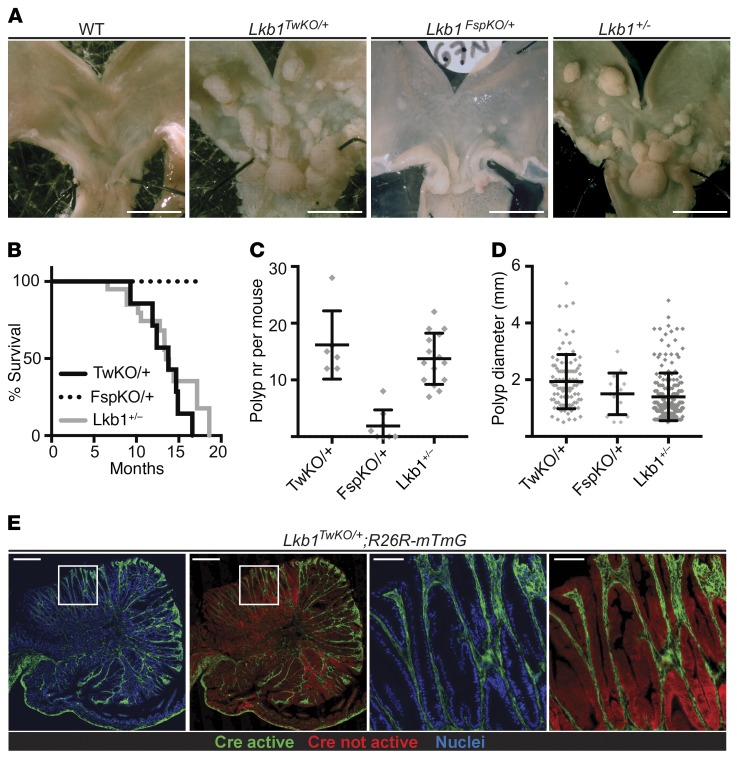
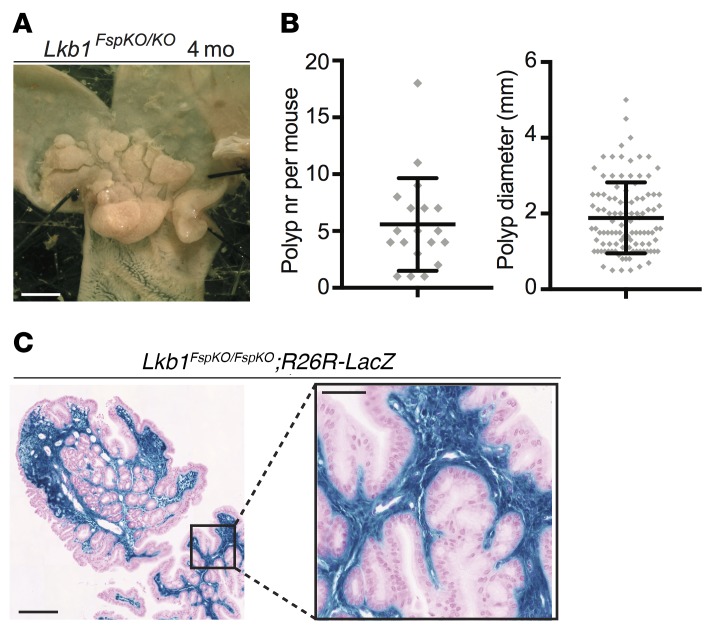
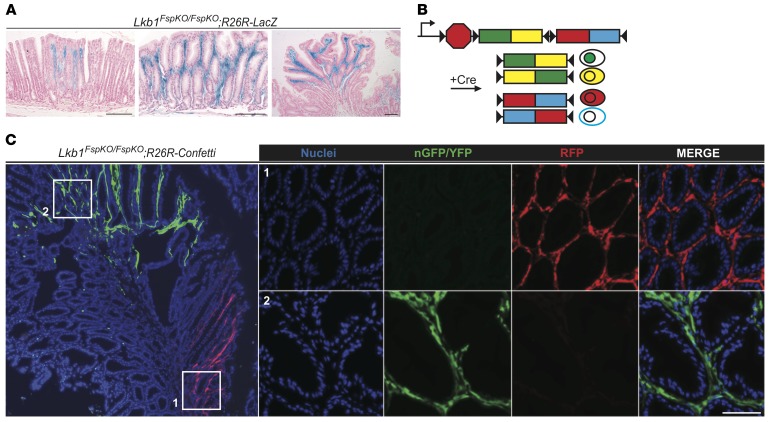
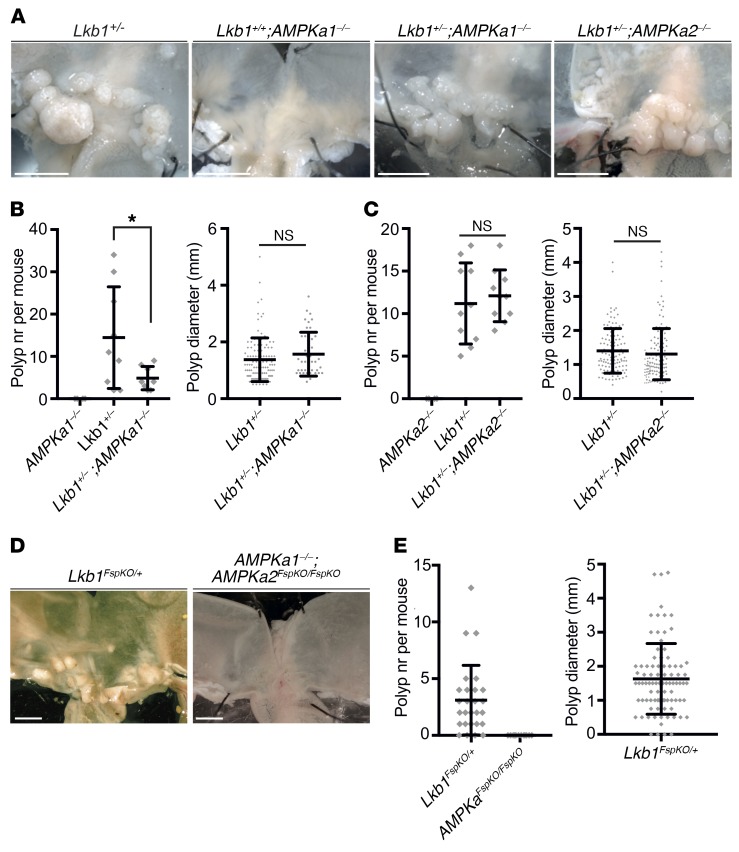
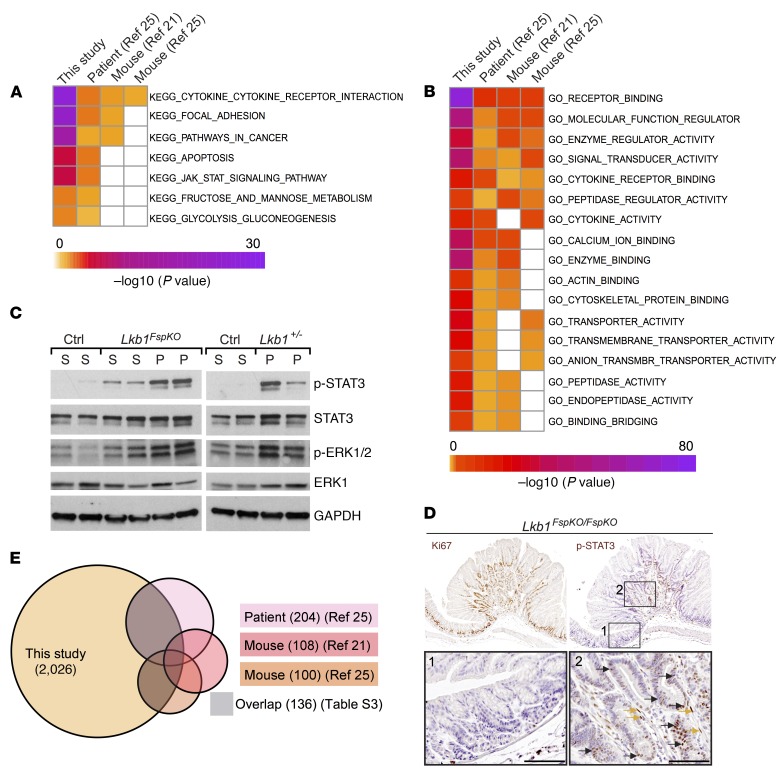
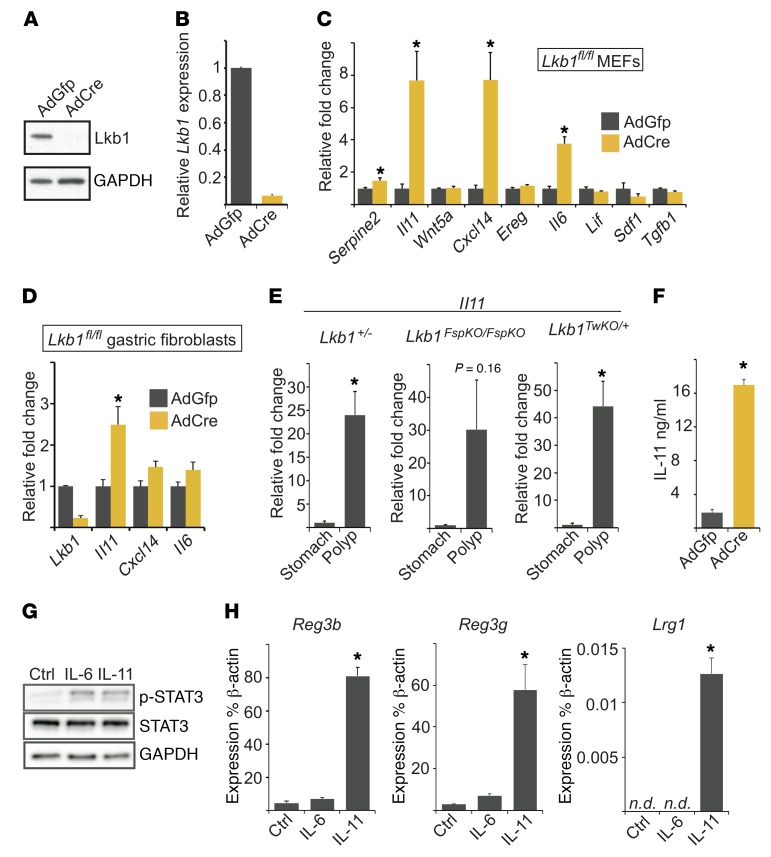
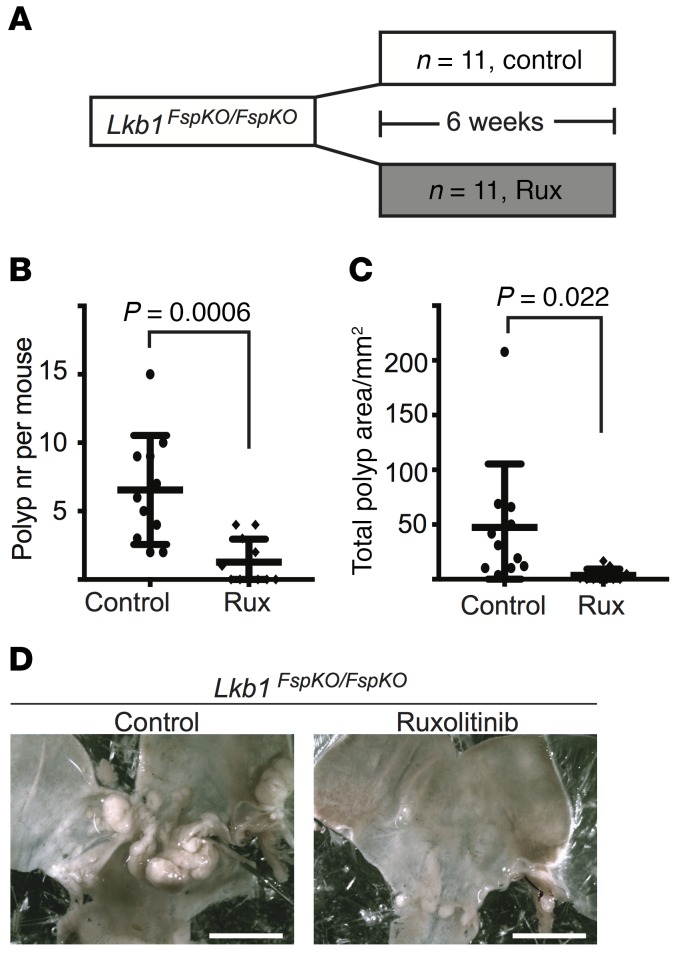
Germline mutations in the gene encoding tumor suppressor kinase LKB1 lead to gastrointestinal tumorigenesis in Peutz-Jeghers syndrome (PJS) patients and mouse models; however, the cell types and signaling pathways underlying tumor formation are unknown. Here, we demonstrated that mesenchymal progenitor- or stromal fibroblast-specific deletion of Lkb1 results in fully penetrant polyposis in mice. Lineage tracing and immunohistochemical analyses revealed clonal expansion of Lkb1-deficient myofibroblast-like cell foci in the tumor stroma. Loss of Lkb1 in stromal cells was associated with induction of an inflammatory program including IL-11 production and activation of the JAK/STAT3 pathway in tumor epithelia concomitant with proliferation. Importantly, treatment of LKB1-defcient mice with the JAK1/2 inhibitor ruxolitinib dramatically decreased polyposis. These data indicate that IL-11-mediated induction of JAK/STAT3 is critical in gastrointestinal tumorigenesis following Lkb1 mutations and suggest that targeting this pathway has therapeutic potential in Peutz-Jeghers syndrome.

Keywords: Gastric cancer; Gastroenterology; Mouse models; Oncology; Tumor suppressors.


Conflict of interest statement

Conflict of interest: The authors have declared that no conflict of interest exists.

Figures

Figure 1
Figure 1. Mesenchymal loss of Lkb1 is sufficient to drive fully penetrant PJS polyposis in mice.
(A) Representative macroscopic images of wild-type, Lkb1+/–, Lkb1TwKO/+, and Lkb1FspKO/+ mouse stomachs at 11 months of age. Scale bars: 5 mm. (B) Survival curve of Lkb1+/– (n = 15), Lkb1TwKO/+ (TwKO/+, n = 7), and Lkb1FspKO/+ mice (FspKO/+, n = 27). Lkb1FspKO/+ mice were followed until 17 months, with no mortality observed. (C and D) Comparison of polyp number (nr) (C) and diameter (D) in Lkb1+/– (n = 15), Lkb1TwKO/+ (TwKO/+, n = 6), and Lkb1FspKO/+ mice (FspKO/+, n = 8) at 11 months of age. Lines depict mean and standard deviation. (E) Cre activity representing Lkb1 heterozygous cells as depicted by GFP signal in Lkb1TwKO/+;R26R-mTmG mouse antral polyp. Representative image is shown. Scale bars: 500 μm and 100 μm (zoom-ins).
Figure 2
Figure 2. Biallelic Fsp1-Cre driven loss of Lkb1 results in polyp development and robust expansion of Lkb1-deficient stroma.
(A) Representative macroscopic image of Lkb1FspKO/FspKO mouse stomach at 4 months (mo) of age. Scale bar: 5 mm. (B) Polyp number (nr) and diameter in Lkb1FspKO/FspKO mice (n = 18) at 4 months of age. Lines depict mean and standard deviation. The polyp number was significantly increased (P < 0.05) in comparison with Lkb1FspKO/+ mice at 11 months (Figure 1C). Polyp size was not significantly different between these cohorts (unpaired 2-tailed t test). (C) Histological section of an X-gal–stained polyp in an Lkb1FspKO/FspKO;R26R-LacZ mouse. Representative image is shown. Scale bars: 100 μm and 20 μm (zoom-in).
Figure 3
Figure 3. Lkb1-deficient stromal cells expand clonally during polyp development.
(A) Representative X-gal–stained antral sections from Lkb1FspKO/FspKO;R26R-LacZ mice with increasing severity of polyposis at 3–4 months of age. Left: Macroscopically normal-looking gastric mucosa with local accumulation of Lkb1-deficient stroma. Middle: Larger expansion of Lkb1-deficient stroma with disorganized glands. Right: Antral polyp demonstrating stroma filled by Lkb1-deficient cells while epithelium remained entirely wild type. Scale bars: 100 μm. (B) Schematic presentation of R26R-Confetti allele. Cre-mediated recombination leads to excision of one of the 2-color cassettes and allows reorientation of the remaining cassette, resulting in the expression of 4 alternative fluorescent colors, nGFP, YFP, RFP, or mCFP (25). Cells expressing similar color are derived from a clonal origin. (C) Left: Low-magnification image of an Lkb1FspKO/FspKO;R26R-Confetti polyp. Note large foci expressing similar fluorescent colors. Right: Zoom-in images of areas with RFP and nGFP/YFP stroma. Representative image is shown. Scale bar: 50 μm.
Figure 4
Figure 4. Inactivation of AMPK does not lead to polyposis.
(A) Representative images of stomachs at 8 months of age with genotypes indicated. (B) Polyp number (left) and diameter (right) of mice of indicated genotypes at 8 months of age. Lkb1+/+;AMPKa1–/– (n = 4), Lkb1+/–; AMPKa1+/+ (n = 9), Lkb1+/-; AMPKa1–/– (n = 8). Lines depict mean and standard deviation. (C) Average polyp number (left) and diameter (right) of mice of indicated genotypes at 8 months of age. Lkb1+/+; AMPKa2–/– (n = 6), Lkb1+/–; AMPKa2+/+ (n = 10), Lkb1+/–; AMPKa2–/– (n = 10). Lines depict mean and standard deviation. (D) Representative images of stomachs at 17 months of age with genotypes indicated. (E) Average polyp number (left) and diameter (right) of mice of indicated genotypes at 17 months of age. Lkb1FspKO/+ (n = 27), AMPKa1–/–; AMPKa2FspKO/FspKO (n = 12). *P < 0.05 as assessed by unpaired t test. n.s., not significant. Lines in graphs depict mean and standard deviation. Two-tailed unpaired t test was used as a statistical test. Scale bars: 5 mm. nr, number; n.s., not significant.
Figure 5
Figure 5. Activation of JAK/STAT3 in polyps.
(A and B) Heatmap of significantly overexpressed KEGG (A) and GO molecular function (B) signatures in our RNA-seq data set, shared with previously published PJS polyp Affymetrix data set and 2 Lkb1+/– mouse polyp Affymetrix data sets. (C) Western blot analysis of STAT3 (p-STAT3-Y705) and MAPK pathway (p-ERK1/2) activation in Lkb1FspKO/FspKO and Lkb1+/– polyps. (D) Representative immunohistochemical analysis of Ki67 and p-STAT3-Y705 in consecutive sections of an Lkb1FspKO/FspKO mouse gastric polyp. Yellow arrows, examples of stromal staining; black arrows, examples of epithelial staining. Scale bars: 100 μm. (E) Venn diagram of overexpressed genes identified in indicated experiments. Genes represented in the RNA-seq data set and at least one of the other data sets (21, 25) (136 genes) are listed in Supplemental Table 3.
Figure 6
Figure 6. Increased expression of Il11 in polyps and Lkb1-deficient fibroblasts.
(A) Western blot and (B) mRNA expression of Lkb1 in primary Lkb1fl/fl MEFs 2 passages after AdCre transduction. Control cells were transduced with AdGFP. (C) Relative mRNA expression of indicated genes after Lkb1 deletion. Data are shown relative to β-actin mRNA levels for triplicate samples and normalized relative to control (AdGFP) cells. MEFs derived from 3 independent embryos of the same genotype were used and data shown are the average of 3 experiments. (D) Relative mRNA expression of indicated genes after Lkb1 deletion. Average of triplicate samples is shown relative to control (AdGFP) cells. Primary gastric fibroblasts derived from 3 independent mice of the same genotype were used and data shown are the average of 3 experiments. (E) Relative expression of Il11 mRNA in PJS mouse model polyps compared with adjacent normal mucosa (genotypes indicated). n = 3–5 mice per data point. (F) ELISA measurement of secreted IL-11 from primary Lkb1fl/fl MEFs after Lkb1 deletion. MEFs derived from 3 independent embryos of the same genotype were used and data shown are the average of 3 experiments. (G) Western blot analysis of p-STAT3-Y705 in wild-type intestinal epithelial crypts incubated for 45 minutes with IL-6 or IL-11 (20 ng/ml). Representative blot of 2 independent experiments is shown. (H) qPCR analysis of Reg3b, Reg3b, and Lrg1 mRNA expression in intestinal organoids cultured with IL-6 and IL-11 (20 ng/ml). Average of 3 experiments is shown. Error bars denote SEM. *P < 0.05 as assessed by paired (C, D, F, and H) or unpaired (E) 2-tailed t test. In qPCR experiments, β-actin was used as the normalizing control. n.d., not detected
Figure 7
Figure 7. Pharmacological JAK inhibition reduces polyposis.
(A) Outline of the experiment. Lkb1FspKO/FspKO mice were treated with ruxolitinib or control for 6 weeks and sacrificed at about 20 weeks of age. (B) Quantification of polyp number (nr) in control and ruxolitinib-treated mice. Lines depict mean and standard deviation. (C) Quantification of total polyp area in control and ruxolitinib-treated mice. Two-tailed unpaired t test was used as a statistical test. (D) Macroscopic images of representative untreated and ruxolitinib-treated mouse stomachs. Scale bars: 50 mm.

Similar articles

Cited by

References

    1. Ollila S, Mäkelä TP. The tumor suppressor kinase LKB1: lessons from mouse models. J Mol Cell Biol. 2011;3(6):330–340. doi: 10.1093/jmcb/mjr016. - DOI - PubMed
    1. Korsse SE, et al. Identification of molecular alterations in gastrointestinal carcinomas and dysplastic hamartomas in Peutz-Jeghers syndrome. Carcinogenesis. 2013;34(7):1611–1619. doi: 10.1093/carcin/bgt068. - DOI - PubMed
    1. de Leng WW, et al. Peutz-Jeghers syndrome polyps are polyclonal with expanded progenitor cell compartment. Gut. 2007;56(10):1475–1476. doi: 10.1136/gut.2007.128132. - DOI - PMC - PubMed
    1. Rossi DJ, et al. Induction of cyclooxygenase-2 in a mouse model of Peutz-Jeghers polyposis. Proc Natl Acad Sci U S A. 2002;99(19):12327–12332. doi: 10.1073/pnas.192301399. - DOI - PMC - PubMed
    1. Jansen M, et al. Mucosal prolapse in the pathogenesis of Peutz-Jeghers polyposis. Gut. 2006;55(1):1–5. doi: 10.1136/gut.2005.069062. - DOI - PMC - PubMed

Publication types

MeSH terms