. 2018 Jan 2;128(1):446-462.
doi: 10.1172/JCI90793. Epub 2017 Dec 4.

CRISPR-Cas9 screen reveals a MYCN-amplified neuroblastoma dependency on EZH2

Affiliations

CRISPR-Cas9 screen reveals a MYCN-amplified neuroblastoma dependency on EZH2

Liying Chen et al. J Clin Invest. .

Abstract

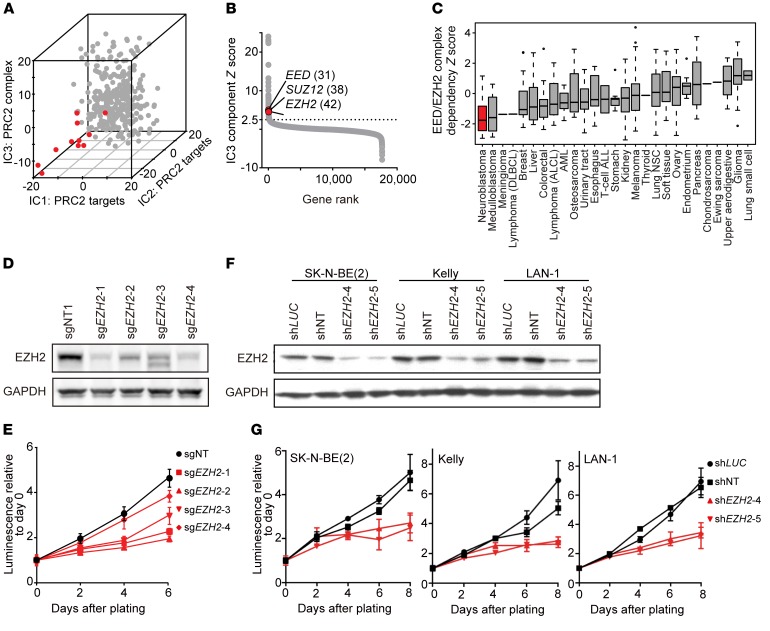
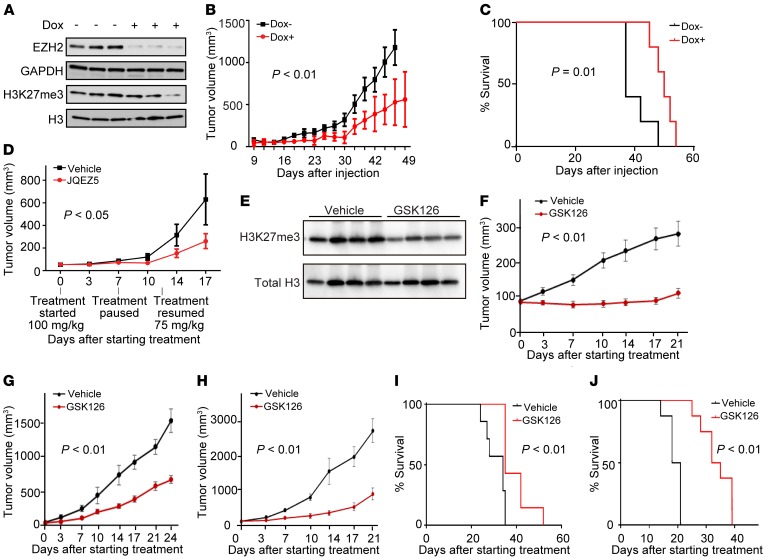
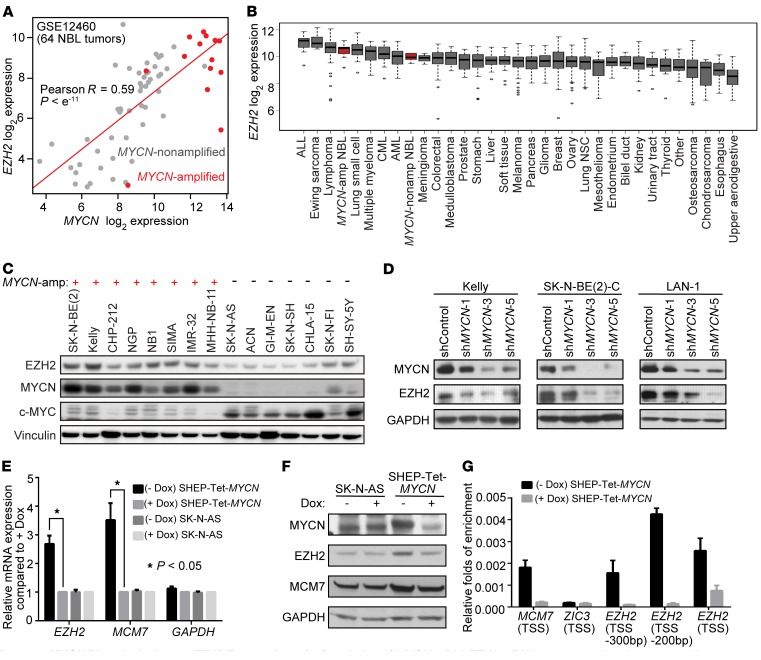
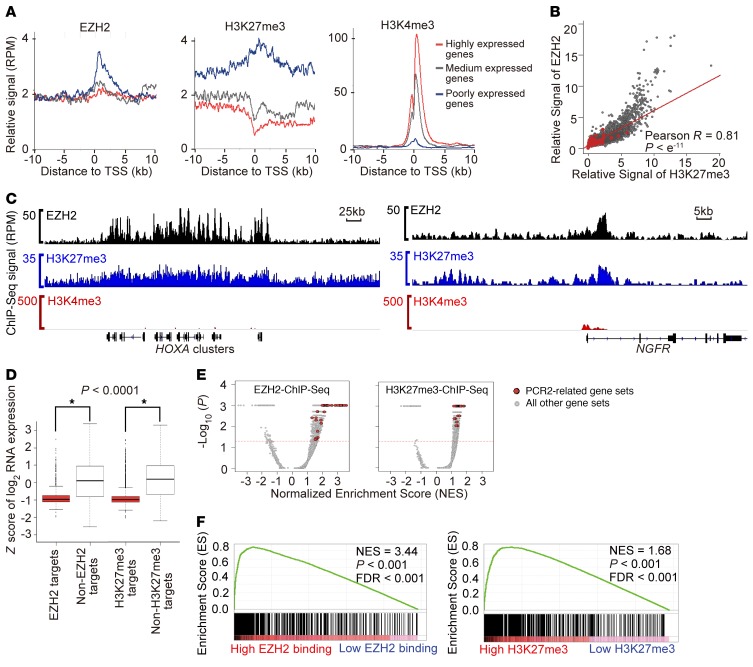
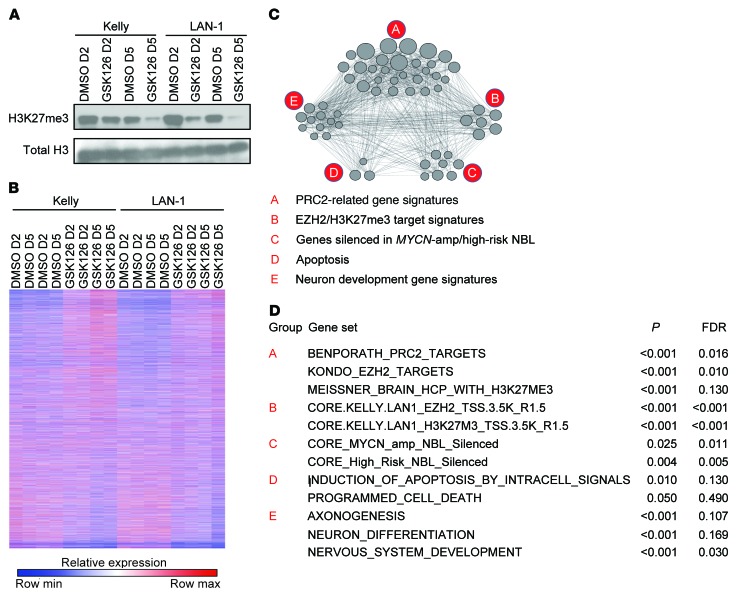
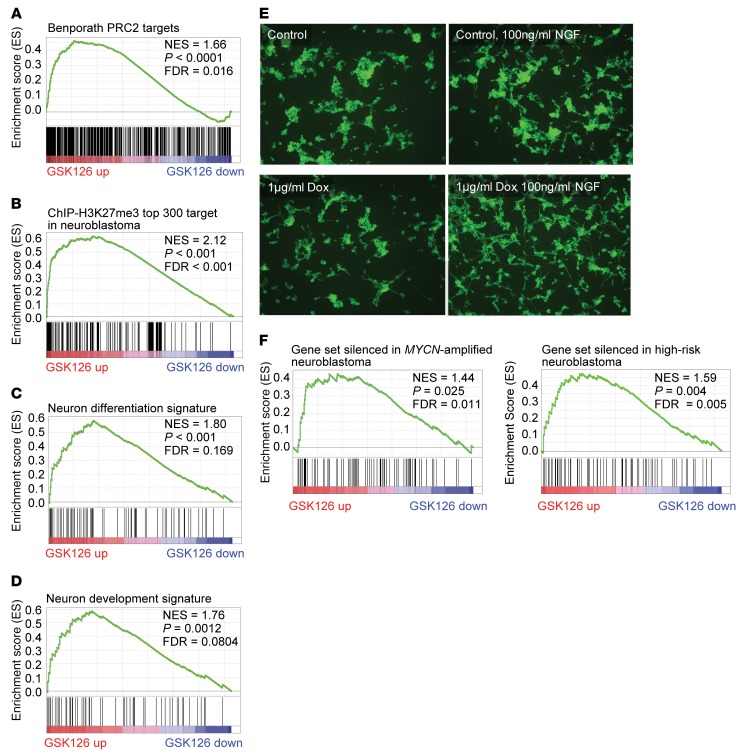
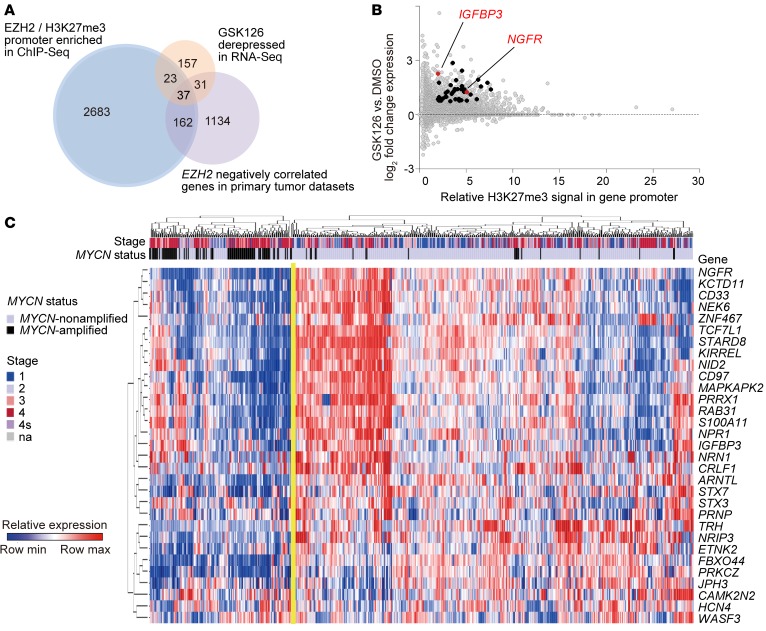
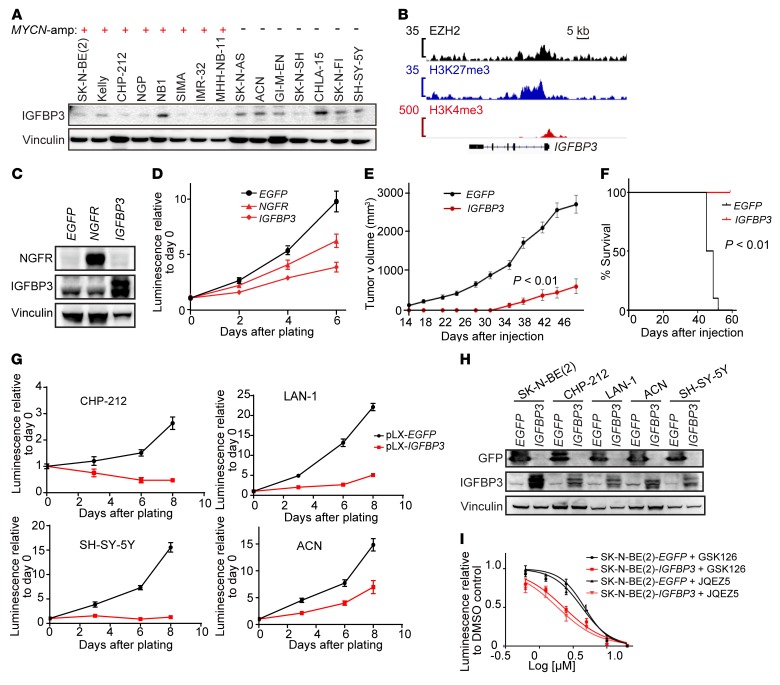
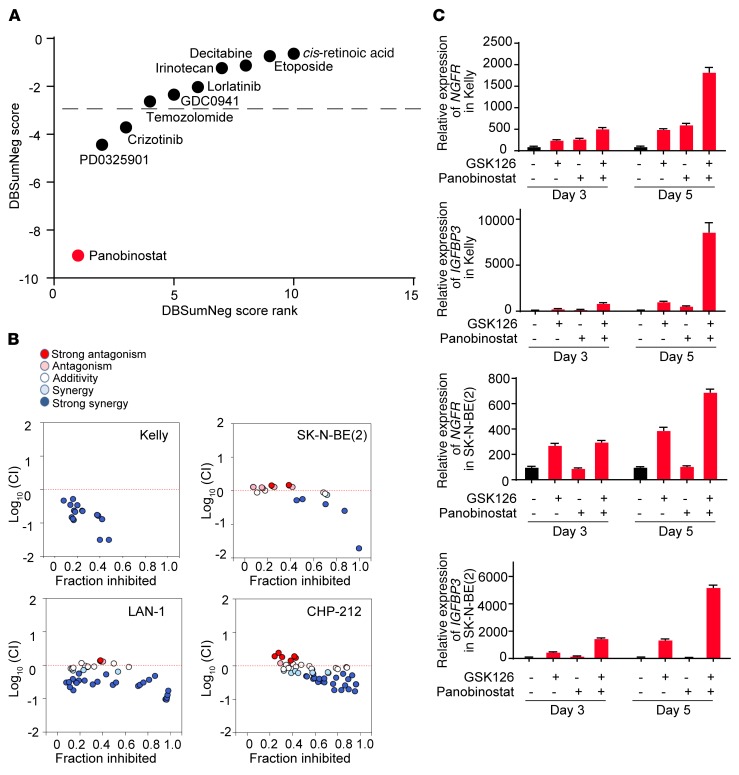
Pharmacologically difficult targets, such as MYC transcription factors, represent a major challenge in cancer therapy. For the childhood cancer neuroblastoma, amplification of the oncogene MYCN is associated with high-risk disease and poor prognosis. Here, we deployed genome-scale CRISPR-Cas9 screening of MYCN-amplified neuroblastoma and found a preferential dependency on genes encoding the polycomb repressive complex 2 (PRC2) components EZH2, EED, and SUZ12. Genetic and pharmacological suppression of EZH2 inhibited neuroblastoma growth in vitro and in vivo. Moreover, compared with neuroblastomas without MYCN amplification, MYCN-amplified neuroblastomas expressed higher levels of EZH2. ChIP analysis showed that MYCN binds at the EZH2 promoter, thereby directly driving expression. Transcriptomic and epigenetic analysis, as well as genetic rescue experiments, revealed that EZH2 represses neuronal differentiation in neuroblastoma in a PRC2-dependent manner. Moreover, MYCN-amplified and high-risk primary tumors from patients with neuroblastoma exhibited strong repression of EZH2-regulated genes. Additionally, overexpression of IGFBP3, a direct EZH2 target, suppressed neuroblastoma growth in vitro and in vivo. We further observed strong synergy between histone deacetylase inhibitors and EZH2 inhibitors. Together, these observations demonstrate that MYCN upregulates EZH2, leading to inactivation of a tumor suppressor program in neuroblastoma, and support testing EZH2 inhibitors in patients with MYCN-amplified neuroblastoma.

Keywords: Epigenetics; Oncology.


Conflict of interest statement

Conflict of interest: J.E. Bradner is the president of the Novartis Institutes for BioMedical Research. W.C. Hahn reports receiving a commercial research grant from Novartis and is a consultant/advisory board member for the same. K. Stegmaier reports receiving a commercial research grant from Novartis and is a consultant for the same. This study, however, was not supported by Novartis grant funding.

Figures

Figure 1
Figure 1. Genome-scale CRISPR-Cas9 screen reveals neuroblastoma dependency on the PRC2 complex components EZH2, EED, and SUZ12.
(A) Projection of the 341 cancer cell lines on the top 3 independent components (IC1, IC2, IC3) that are enriched for depletion in neuroblastoma (red) versus other cell lines (gray). (B) Rank of IC3 component genes by the gene Z score in the component with rank in parentheses. (C) Neuroblastoma is the cancer type with the most depletion in the CRISPR-Cas9 screen for the EED/EZH2 complex based on single-sample enrichment analysis. (D and E) Immunoblot (D) and cell viability assay (E) after CRISPR-Cas9 knockout of EZH2 with 4 EZH2 sgRNAs in SK-N-BE(2). Results are representative of 3 independent experiments; mean ± SD of 8 technical replicates is shown. (F and G) Immunoblot (F) and cell viability assay (G) after shRNA-mediated suppression of EZH2 in SK-N-BE(2), Kelly, and LAN-1. Results are representative of 3 independent experiments; mean ± SD of 8 technical replicates is shown.
Figure 2
Figure 2. Pharmacological inhibition of EZH2 inhibits neuroblastoma growth in vitro.
(A and B) Neuroblastoma cells treated with the EZH2 inhibitor JQEZ5 (A) or GSK126 (B) for 5 days in vitro. Results are representative of 3 independent experiments; data represent mean ± SD of 4 technical replicates. (C and D) Immunoblot showing target inhibition by JQEZ5 or GSK126 in the neuroblastoma cell lines Kelly (C) and ACN (D). (E) Percent of annexin V–positive cells in the cell lines treated with 3 μM JQEZ5, GSK126, or DMSO control for 8–10 days. Mean ± SD of 3 technical replicates is shown. *P < 0.05 by 2-tailed Student’s t test. (F) Cell cycle analysis in neuroblastoma cell lines treated with 3 μM JQEZ5, GSK126, or DMSO for 7 days. Results are representative of 3 independent experiments.
Figure 3
Figure 3. Genetic and pharmacological inhibition of EZH2 inhibits growth in vivo.
(A) Tumor EZH2 and H3K27me3 levels in mice implanted with the human neuroblastoma cell line NGP expressing a doxycycline-inducible shEZH2 after 20 days of doxycycline or control treatment in vivo. Proteins and histones were extracted from tumors in 3 control mice and in 3 doxycycline-treated mice. GAPDH is a control for EZH2, and H3 is a control for H3K27me3. (B) Tumor volume in mice (n = 5 for each group) implanted with NGP cells expressing a doxycycline-inducible shEZH2. Results are representative of 2 independent experiments; mean ± SEM is shown. P calculated using 2-way ANOVA. (C) Kaplan-Meier curves with log-rank (Mantel-Cox) test showing overall survival of mice (n = 5 for control and n = 5 for doxycycline treated) implanted with the neuroblastoma cell line NGP expressing a doxycycline-inducible shEZH2. Results are representative of 2 independent experiments. (D) Tumor volume in mice (n = 10 for each group) treated with JQEZ5 or vehicle in a mouse xenograft model of the neuroblastoma cell line Kelly. Mean ± SEM is shown. P calculated using 2-way ANOVA. (E) H3K27me3 levels in mice with human neuroblastoma cell line CHP-212 xenograft after 10 days of GSK126 or vehicle treatment. Histones were extracted from circulating white blood cells in 4 GSK126-treated mice and 4 vehicle-treated mice. (FH) Tumor volume over 21-day treatment with vehicle or 150 mg/kg/d GSK126 treatment in a mouse xenograft model of CHP-212 (F, n = 8 each), SK-N-BE(2) (G, n = 7 each), and SH-SY-5Y (H, n = 8 each). Mean ± SEM is shown. P calculated using 2-way ANOVA. (I and J) Kaplan-Meier curves show overall survival of mice with SK-N-BE(2) (I, n = 7 each) or SH-SY-5Y (J, n = 8 each). P calculated using log-rank (Mantel-Cox) test.
Figure 4
Figure 4. MYCN directly activates EZH2 expression.
(A) Correlation of MYCN mRNA and EZH2 mRNA expression in primary neuroblastoma (NBL) tumor samples based on Affymetrix data GSE12460. P computed with the rcorr function (R-CRAN, Hmisc library). (B) EZH2 mRNA expression across Cancer Cell Line Encyclopedia cancer cell lines with neuroblastoma cell lines in red. (C) Immunoblot of protein levels of EZH2, MYCN, and MYC in MYCN-amplified compared with MYCN-nonamplified neuroblastoma cells. (D) Effect of MYCN suppression on EZH2 protein levels. Results are representative of 2 independent experiments. (E and F) Effect of conditional overexpression of MYCN on EZH2 expression at the transcription level (E) and the protein level (F) in the MYCN-nonamplified neuroblastoma cell line SHEP. The SHEP-Tet-MYCN cell line was generated by stable transduction of SHEP with a Tet-off MYCN construct. MCM7 is a known MYCN target gene. SK-N-AS is an unmodified MYCN-nonamplified neuroblastoma cell line. Mean ± SEM of 3 independent experiments shown. *P < 0.05 by 2-tailed Student’s t test. (G) ChIP–quantitative PCR with MYCN antibody showing the enrichment of MYCN in the promoter region of EZH2 in MYCN-overexpressing SHEP-Tet-MYCN cells. MCM7 is a positive control, and ZIC3 is a negative control. TSS, transcription start site. Results are representative of 2 independent experiments; mean ± SD of 3 technical replicates is shown.
Figure 5
Figure 5. Genome-wide EZH2 binding pattern in MYCN-amplified neuroblastoma Kelly cells.
(A) Metagene analysis showing the average ChIP-Seq binding signals of EZH2, H3K27me3, or H3K4me3 for 500 randomly selected genes in each of 3 categories based on the gene expression level. The x axis shows the distance in kilobases to the transcription start site (TSS). The y axis shows signal in reads per million (RPM). (B) Scatter plot of the genome-wide correlation between EZH2 relative binding signal and H3K27me3 relative binding signal in the promoter region. P computed with the rcorr function (R-CRAN, Hmisc library). (C) Gene track showing high binding signal for EZH2 and H3K27me3 with low binding signal for H3K4me3 in 2 published validated EZH2 targets. (D) Box plots of expression values for EZH2 target genes versus non-EZH2 target genes and H3K27me3 target genes versus non-H3K27me3 target genes in Kelly. *P < o.ooo1 using 2-tailed Student’s t test. (E) GSEA volcano plot enrichment of published PRC2 target signatures from MSigDB version 5.1 among genes with high EZH2 binding signal (left) or high H3K27me3 binding signal (right) in Kelly cells. (F) Enrichment of Benporath PRC2 target signature among genes with high EZH2 promoter binding signal (left) or high H3K27me3 promoter binding signal (right) in Kelly cells.
Figure 6
Figure 6. Transcriptome changes in response to GSK126 treatment.
(A) Immunoblots showing H3K27me3 changes after 2 and 5 days of treatment with 2 μM GSK126 or DMSO. (B) Heatmap of RNA-Seq gene expression following 2 and 5 days of 2 μM GSK126 treatment of neuroblastoma cell lines Kelly and LAN-1. (C) Functional enrichment map depicts the functional groups of the GSEA hits for the GSK126 treatment effect on neuroblastoma cell lines Kelly and LAN-1. The nodes correspond to enriched gene sets. An edge connects 2 nodes if the corresponding gene sets are overlapping. (D) The top enriched gene sets from each functional group depicted in the enrichment map.
Figure 7
Figure 7. Effect of pharmacological and genetic suppression of EZH2.
(A) GSEA showing enrichment of Benporath PRC2 target signature in genes upregulated by EZH2 inhibitor GSK126. (B) GSEA showing that genes upregulated with GSK126 treatment are enriched for the top 300 genes with highest H3K27me3 ChIP-Seq signal in Kelly and LAN-1 cells. (C) GSEA showing enrichment of neuron differentiation signature in genes upregulated by GSK126. (D) GSEA showing enrichment of neuron development signature in genes upregulated by GSK126. (E) The effect of conditional knockdown of EZH2 on NGF-induced neurite outgrowth in neuroblastoma cell line NGP. Shown is immunocytochemistry with βIII-tubulin antibodies, with photographs representative of 5 fields taken at ×100 original magnification. (F) GSEA showing that genes upregulated with GSK126 treatment are enriched for genes silenced in MYCN-amplified and high-risk neuroblastoma based on primary tumor expression data sets.
Figure 8
Figure 8. Integrative analysis reveals EZH2 function.
(A) Schematic representation of the integrative analysis to identify EZH2-regulated neuroblastoma tumor suppressors. Venn diagrams present the number of hits identified by the integrative analysis studies. (B) Scatter plot showing whole-genome promoter binding H3K27me3 relative signal (x axis) versus whole-genome transcriptome changes in response to GSK126 (y axis). Highlighted are the 37 genes with high H3K27me3 binding, upregulated by GSK126 and anticorrelated with EZH2 expression in primary neuroblastoma transcriptome data sets. (C) Heatmap of the EZH2 neuroblastoma signature developed by the integrative analysis depicted in A across 562 annotated neuroblastoma tumors.
Figure 9
Figure 9. EZH2-regulated gene IGFBP3 functions as a neuroblastoma tumor suppressor.
(A) The protein expression level of IGFBP3, a representative gene in the neuroblastoma EZH2 signature, in human neuroblastoma cell lines with or without MYCN amplification. (B) EZH2, H3K27me3, and H3K4me3 binding signal at the promoter of IGFBP3 in Kelly cells. (C) Immunoblot showing the overexpression of EGFP (negative control), NGFR (positive control), and IGFBP3 in SK-N-BE(2) cell line. (D) Cell viability assay after overexpression of EGFP, NGFR, or IGFBP3 in SK-N-BE(2). Results are representative of 3 independent experiments; mean ± SD of 8 technical replicates is shown. (E) Tumor volume in mouse xenograft model of SK-N-BE(2) with or without IGFBP3 overexpression (n = 10). P calculated with 2-way ANOVA. (F) Kaplan-Meier curves show survival of mice with xenografts of SK-N-BE(2) with or without IGFBP3 overexpression, up to 56 days after injection. P calculated using log-rank (Mantel-Cox) test. (G and H) Cell viability assay (G) and immunoblotting (H) after overexpression of IGFBP3 in CHP-212, LAN-1, ACN, and SH-SY-5Y. Results are representative of 3 independent experiments; data in G represent mean ± SD of 8 technical replicates. (I) Effect of overexpression of IGFBP3 on SK-N-BE(2)’s response to EZH2 inhibitors. Shown is a representative of 2 independent experiments; mean ± SD of 8 technical replicates is shown.
Figure 10
Figure 10. Drug synergy of EZH2 inhibitor GSK126 and small-molecule compounds.
(A) Delta Bliss Sum Negative (DBSumNeg) score of drug synergy analysis with GSK126 treatment in Kelly cells on day 6 in vitro. The synergistic combinations were estimated based on DBSumNeg score cutoff < –3. Results are representative of 3 independent experiments. (B) Combination index analysis of GSK126 and panobinostat in 4 neuroblastoma cell lines. Dotted red line is the line of additivity between antagonism (>0) and synergy (<0). Light blue is significant synergy (log10 [CI] < –0.10), and dark blue is strong synergy (log10 [CI] < –0.22). Results are representative of 2–3 independent experiments. (C) Relative mRNA expression changes upon combination treatment of GSK126 and panobinostat, compared with single-agent treatment. All expression is normalized to DMSO. Results are representative of 3 independent experiments; mean ± SD of 4 technical replicates is shown.

Similar articles

Cited by

References

    1. Lawrence MS, et al. Mutational heterogeneity in cancer and the search for new cancer-associated genes. Nature. 2013;499(7457):214–218. doi: 10.1038/nature12213. - DOI - PMC - PubMed
    1. Neff T, Armstrong SA. Recent progress toward epigenetic therapies: the example of mixed lineage leukemia. Blood. 2013;121(24):4847–4853. doi: 10.1182/blood-2013-02-474833. - DOI - PMC - PubMed
    1. Delattre O, et al. Gene fusion with an ETS DNA-binding domain caused by chromosome translocation in human tumours. Nature. 1992;359(6391):162–165. doi: 10.1038/359162a0. - DOI - PubMed
    1. Schwab M, et al. Amplified DNA with limited homology to myc cellular oncogene is shared by human neuroblastoma cell lines and a neuroblastoma tumour. Nature. 1983;305(5931):245–248. doi: 10.1038/305245a0. - DOI - PubMed
    1. Kennedy AL, et al. Functional, chemical genomic, and super-enhancer screening identify sensitivity to cyclin D1/CDK4 pathway inhibition in Ewing sarcoma. Oncotarget. 2015;6(30):30178–30193. doi: 10.18632/oncotarget.4903. - DOI - PMC - PubMed

Publication types

MeSH terms

Substances