. 2017 Dec 4;17(1):231.
doi: 10.1186/s12870-017-1155-7.

Transcriptomic and metabolic responses of Calotropis procera to salt and drought stress

Affiliations

Transcriptomic and metabolic responses of Calotropis procera to salt and drought stress

Mohammed Z Mutwakil et al. BMC Plant Biol. .

Abstract

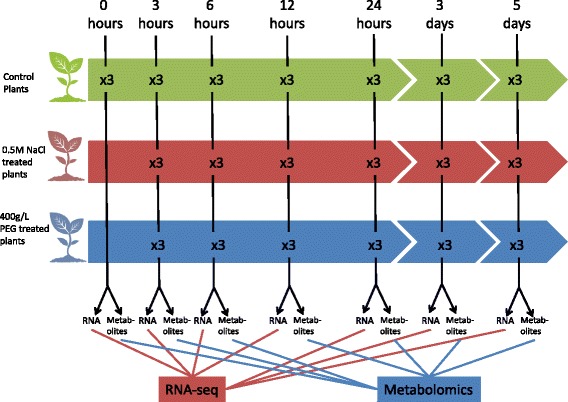
Background: Calotropis procera is a wild plant species in the family Apocynaceae that is able to grow in harsh, arid and heat stressed conditions. Understanding how this highly adapted plant persists in harsh environments should inform future efforts to improve the hardiness of crop and forage plant species. To study the plant response to droμght and osmotic stress, we treated plants with polyethylene glycol and NaCl and carried out transcriptomic and metabolomics measurements across a time-course of five days.

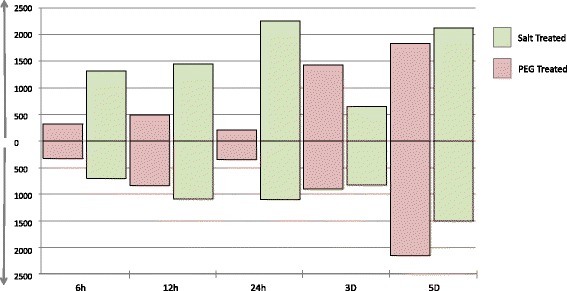
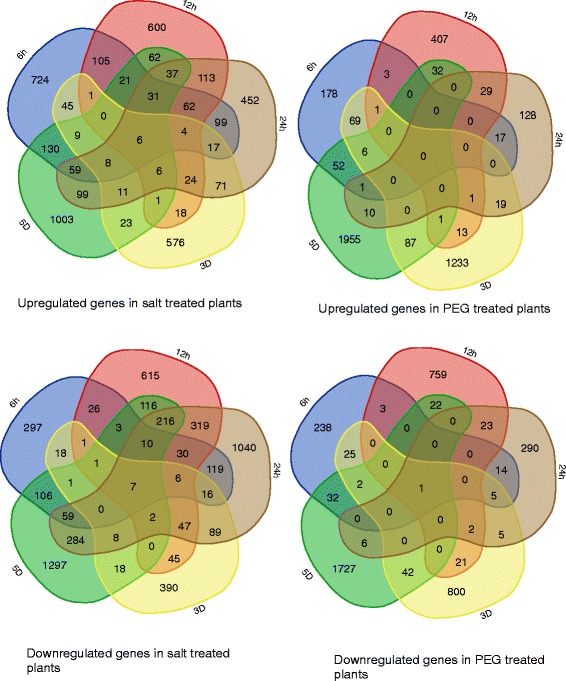
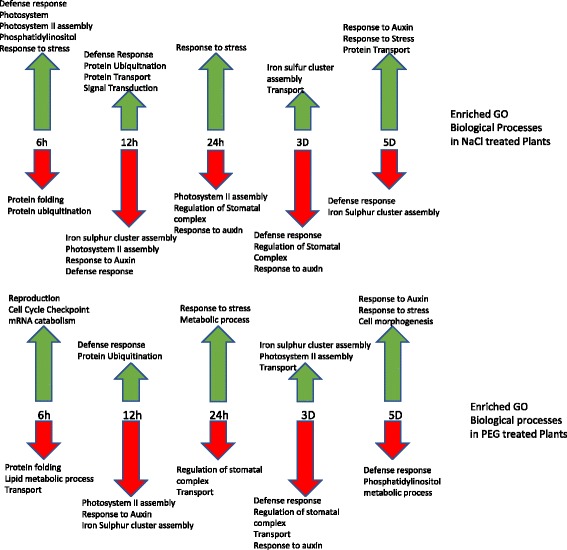
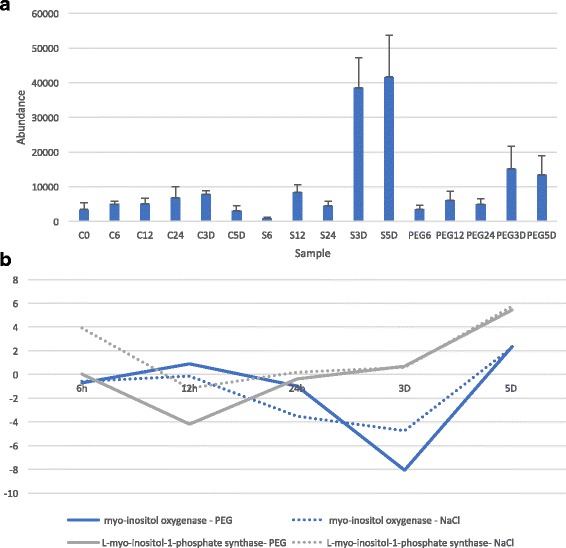
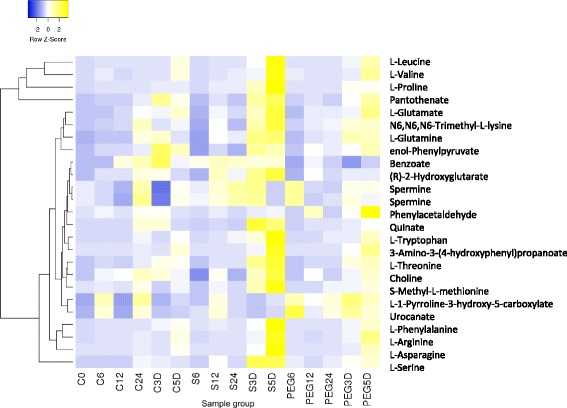
Results: We identified a highly dynamic transcriptional response across the time-course including dramatic changes in inositol signaling, stress response genes and cytokinins. The resulting metabolome changes also involved sharp increases of myo-inositol, a key signaling molecule and elevated amino acid metabolites at later times.

Conclusions: The data generated here provide a first glimpse at the expressed genome of C. procera, a plant that is exceptionally well adapted to arid environments. We demonstrate, through transcriptome and metabolome analysis that myo-inositol signaling is strongly induced in response to drought and salt stress and that there is elevation of amino acid concentrations after prolonged osmotic stress. This work should lay the foundations of future studies in adaptation to arid environments.

Keywords: Drought stress; Metabolomics; Myo-inositol; Salt stress; Transcriptomics.


Conflict of interest statement

Ethics approval and consent to participate

Not applicable.

Consent for publication

Not applicable.

Competing interests

The authors declare that they have no competing interests.

Publisher’s Note

Springer Nature remains neutral with regard to jurisdictional claims in published maps and institutional affiliations.

Figures

Fig. 1
Fig. 1
Experimental design for this study. Three groups of plants were used. A control group that were administered water, plants that were administered 0.5 M NaCl and a group administered 400 g/L of PEG at time 0. They were followed for 5 days and three plants samples at each time point. Metabolites and RNA were extracted from 3 replicates from each group and the data compared
Fig. 2
Fig. 2
Multi-Dimensional Scaling plot for count data. MDS plot based on raw read count data of 20,000 genes for each sample. C6, C12, C24, C3 and C5 correspond to control plants at 6 h, 12 h, 24 h, 3 days, and 5 days, respectively. S6, S12, S24, S3 and S5 correspond to salt treated plants at 6 h, 12 h, 24 h, 3 days, and 5 days, respectively. P6, P12, P24, P3 and P5 correspond to PEG treated plants at 6 h, 12 h, 24 h, 3 days, and 5 days, respectively. Each replicate is labelled _1, _2, or _3. Lines connect samples from the same treatment and time point
Fig. 3
Fig. 3
Number of up and downregulated genes in PEG and NaCl treated C. procera plants. Bars above the x-axis represent the number of up regulated genes relative to the control plants sampled at the same time point and bars below the x-axis represent the number of down regulated genes relative to the control plants sampled at the same time point
Fig. 4
Fig. 4
Venn diagrams of shared up and downregulated genes in C. procera across time. Each group is labelled 6 h, 12 h, 24 h, 3D, 5D for 6 h, 12 h, 24 h, 3 days, and 5 days, respectively
Fig. 5
Fig. 5
Selected Gene Ontology “Biological Process” terms in C. procera that are enriched in up and downregulated genes in PEG and NaCl treated plants. Enriched GO “Biological Processes” terms in NaCl treated plants, B. Enriched GO “Biological processes” terms in PEG treated plants. Up-arrows correspond to terms enriched in up regulated genes. Down-arrows correspond to terms enriched in down regulated genes
Fig. 6
Fig. 6
Myo-inositol abundance and myo-inositol metabolism gene expression in C. procera. a: Myo-inositol abundance as measured by metabolome analysis across all sample groups. b: Gene expression of myo-inositol metabolism genes myo-inositol oxygenase and L-myoinositol-1-phosphate synthase in PEG and NaCl treatments
Fig. 7
Fig. 7
Amino acid pathway metabolite relative abundance across samples in C. procera. Heatmap of Z-scores for amino acid abundance as measured by metabolomics analysis across all sample groups. The dendrogram shows Average linkage clustering of metabolite abundance.

References

    1. Greiss E. Anatomical identification of plant remains and other materials from el-Omari excavation at Helwan from the first dynasty. Bull Inst Egypt. 1955;36:227–235.
    1. Ebbell B. A contribution to the earliest history of leprosy. Int J Leprosy. 1935;3:257–263.
    1. Shivkar YM, Kumar VL. Anthelmintic activity of latex of Calotropis Procera. Pharm Biol. 2008;41(4):263–265. doi: 10.1076/phbi.41.4.263.15666. - DOI
    1. Parhira S, Yang ZF, Zhu GY, Chen QL, Zhou BX, Wang YT, Liu L, Bai LP, Jiang ZH. In Vitro anti-influenza virus activities of a new Lignan glycoside from the latex of Calotropis Gigantea. PLoS One. 2014;9(8) - PMC - PubMed
    1. Aziz MA, Khan AH, Adnan M, Izatullah I. Traditional uses of medicinal plants reported by the indigenous communities and local herbal practitioners of Bajaur agency, federally administrated tribal areas, Pakistan. J Ethnopharmacol. 2017;198:268–281. doi: 10.1016/j.jep.2017.01.024. - DOI - PubMed

LinkOut - more resources