. 2017 Dec 4;12(1):88.
doi: 10.1186/s13024-017-0230-8.

Anti-aggregant tau mutant promotes neurogenesis

Affiliations

Anti-aggregant tau mutant promotes neurogenesis

Maria Joseph et al. Mol Neurodegener. .

Abstract

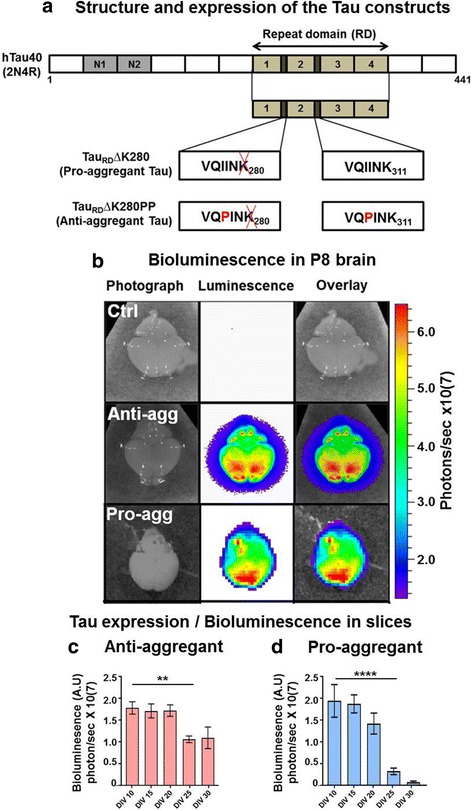
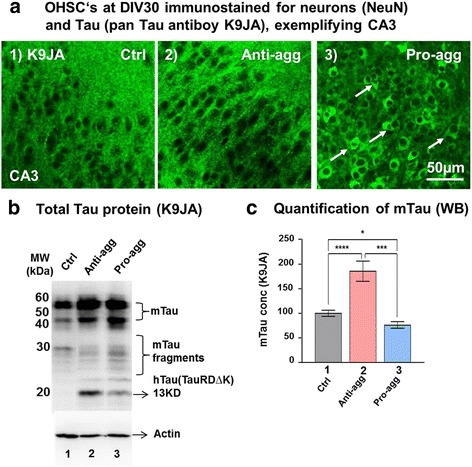
Background: The microtubule-associated protein Tau plays a role in neurodegeneration as well as neurogenesis. Previous work has shown that the expression of the pro-aggregant mutant Tau repeat domain causes strong aggregation and pronounced neuronal loss in the hippocampus whereas the anti-aggregant form has no deleterious effects. These two proteins differ mainly in their propensity to form ß structure and hence to aggregate.

Methods: To elucidate the basis of these contrasting effects, we analyzed organotypic hippocampal slice cultures (OHSCs) from transgenic mice expressing the repeat domain (RD) of Tau with the anti-aggregant mutation (TauRDΔKPP) and compared them with slices containing pro-aggregant TauRDΔK. Transgene expression in the hippocampus was monitored via a sensitive bioluminescence reporter gene assay (luciferase).

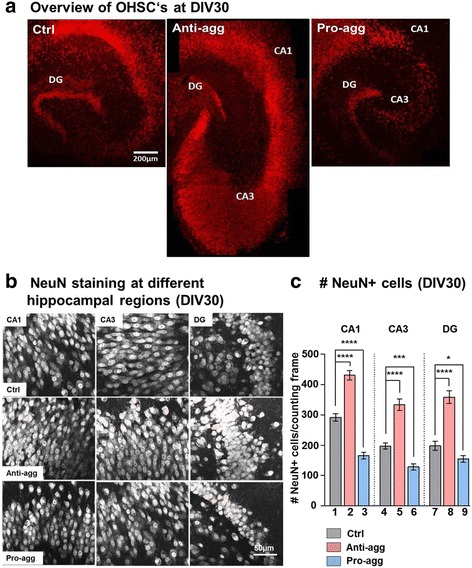
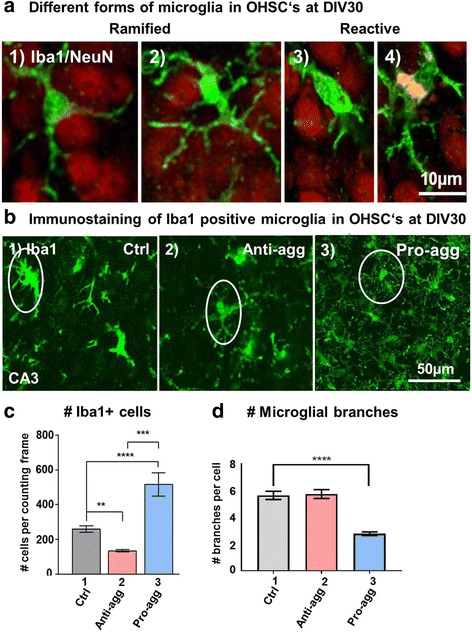
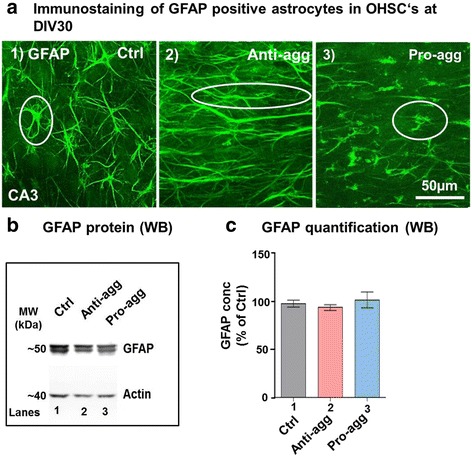
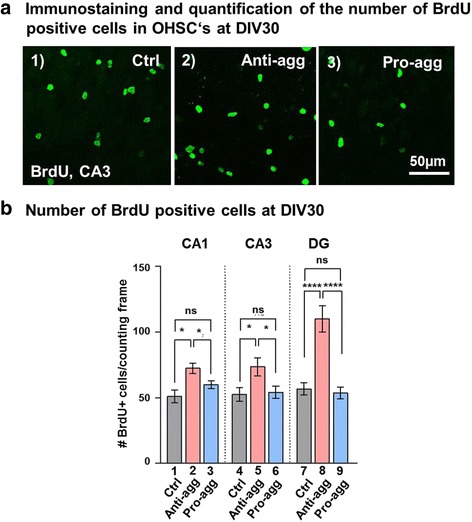
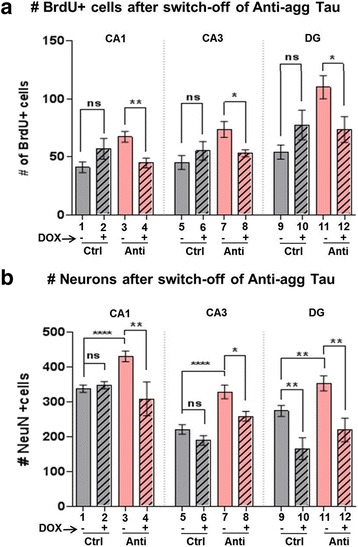
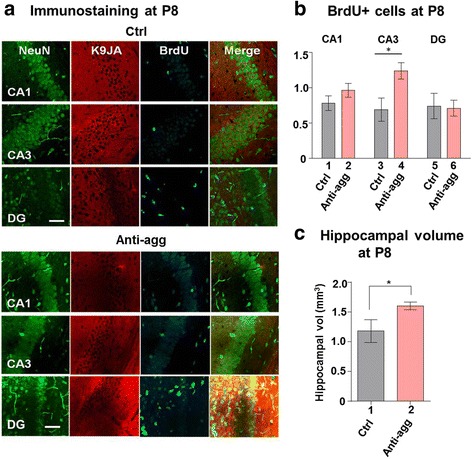
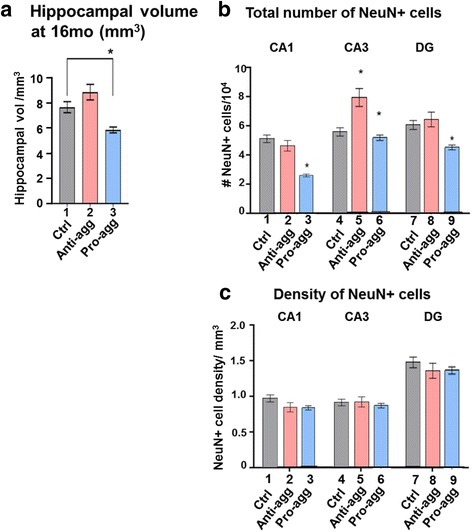
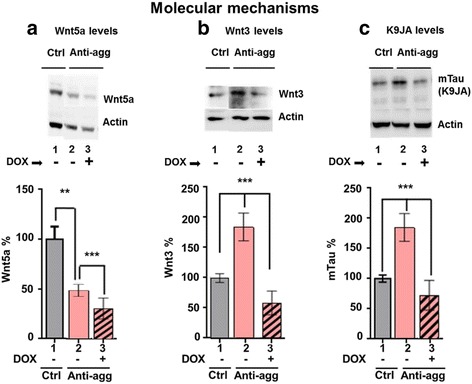
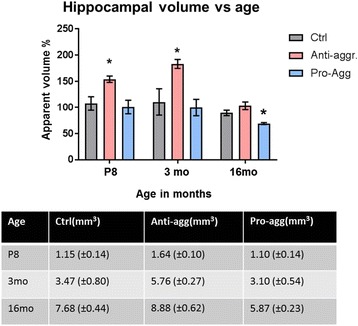
Results: The expression of the anti-aggregant TauRDΔKPP leads to a larger volume of the hippocampus at a young age due to enhanced neurogenesis, resulting in an increase in neuronal number. There were no signs of activation of microglia and astrocytes, indicating the absence of an inflammatory reaction. Investigation of signaling pathways showed that Wnt-5a was strongly decreased whereas Wnt3 was increased. A pronounced increase in hippocampal stem cell proliferation (seen by BrdU) was observed as early as P8, in the CA regions where neurogenesis is normally not observed. The increase in neurons persisted up to 16 months of age.

Conclusion: The data suggest that the expression of anti-aggregant TauRDΔKPP enhances hippocampal neurogenesis mediated by the canonical Wnt signaling pathway, without an inflammatory reaction. This study points to a role of tau in brain development and neurogenesis, in contrast to its detrimental role in neurodegeneration at later age.

Keywords: CA3; Hippocampus; Neurogenesis; Tau; Wnt.


Conflict of interest statement

Ethical approval

Animals were housed and tested according to standards of the German Animal Welfare Act.

Consent for publication

The authors have no conflict of interest.

Competing interests

The authors declare that they have no competing interests.

Publisher’s Note

Springer Nature remains neutral with regard to jurisdictional claims in published maps and institutional affiliations.

Figures

Fig. 1
Fig. 1
Expression level of the exogenous human anti-aggregant TauRDΔKPP and pro-aggregant TauRD∆K. a The anti-aggregant and pro-aggregant construct is based on the human Tau 4-repeat domain carrying the FTDP-17 mutation ΔK280 near the beginning of R2. The four repeats in the C-terminal half of Tau are highlighted in green (R1-R4). The two hexapeptide motifs at the beginning of R2 and R3 are capable of promoting aggregation by inducing ß-structure. The ΔK280 mutation promotes aggregation, and the two proline mutations inhibit it. b Luciferase activity within the brains of pups: Control (top row), expressing anti-aggregant TauRDΔKPP (middle row) or pro-aggregant TauRDΔK (bottom row) at post-natal day 8 (P8), as determined by bioluminescence (photons/sec). The control brain does not show any luciferase signal, the anti-aggregant TauRDΔKPP brain shows an intense luciferase signal (middle and right panel), ranging from 2 - 6x 10⁷ photons per second (blue to red, see heat scale on right), predominantly in the frontal part of the brain. A similar expression pattern is seen in the pro-aggregant TauRDΔK brain at P8. c Luciferase activity monitored in slices of anti-aggregant mice from DIV10 to DIV30. The signal remains roughly constant from DIV10 to DIV20 and then declines down to ~40% at DIV25-30 (because of the aging process in the slice cultures). Data are expressed as a mean ±SEM of 4-6 slices from 10 different animals and analyzed by unpaired Student´s t-test. ** P-value <0.01. d Luciferase activity monitored in slices of pro-aggregant mice from DIV10 to DIV30. There is a similar nearly constant expression of TauRD∆K from DIV10-20, followed by a strong decline. Data are expressed as a mean ±SEM of 4-6 slices from 10 different animals and analyzed by unpaired Student´s t-test. **** P-value <0.0001
Fig. 2
Fig. 2
Increased number of neurons in anti-aggregant TauRDΔKPP organotypic hippocampal slice culture. a OHSCs were prepared from control, anti-aggregant TauRDΔKPP and pro-aggregant TauRDΔK pups aged P8. Slices were fixed at DIV30 and immunostained with NeuN antibody. Overview image of a single slice aged DIV30 from the controls, anti-aggregant TauRDΔKPP and the pro-aggregant TauRDΔK shows a 30% increase of hippocampal size in the anti-aggregant TauRDΔKPP slice compared to the age-matched controls. On the contrary the pro-aggregant TauRDΔK slice shows a similar size of the hippocampus as in the controls but with intense neuronal loss in the CA3 region. Scale bar 200μm. b Representative image of the CA1, CA3 and DG regions of the hippocampus stained with NeuN from controls, anti-aggregant TauRDΔKPP and pro-aggregant TauRDΔK slices. Scale bar 50μm. Cell bodies of pyramidal neurons in the CA region and the granular neurons in the DG region are clearly distinguishable. c Graph showing the number of NeuN+ cells per counting frame in the different regions of the hippocampus. An increase by 47% of the number of NeuN+ cells is observed in the CA1, 69% in CA3 and 81% increase in neuronal number in DG in the anti-aggregant TauRDΔKPP slices (pink bars) when compared to the controls (grey bars). By contrast, the pro-aggregant TauRDΔK slices (blue bars) show 44% reduced neuronal number in the CA1, 33% reduced neuronal number in CA3 and 22% DG compared to the age matched controls (grey). Results are given as mean ±SEM of 10 animals and 4-6 slices per animal. Data were analyzed by Student's t-test. *p<0.05, ***p<0.001 ****p<0.0001 compared to control slices
Fig. 3
Fig. 3
Decrease in microglial number in anti-aggregant TauRDΔKPP slices and increased microgliosis in the pro-aggregant TauRDΔK slices. OHSCs from control, anti-aggregant TauRDΔKPP and pro-aggregant TauRDΔK P8 pups were prepared and cultured until DIV30. Slices were stained with Iba1 antibody against microglia. a Representation of different types of microglia in the OHSCs. OHSCs from the control slices at DIV30 were immunostained with Iba1 (green) for microglia and NeuN (red) for neurons. The two panels on the left show the ramified form of microglia with multiple branches. The two right panels show the reactive form of microglia with fewer processes. Interestingly the last panel shows a microglia engulfing neuronal debris (note that the debris is stained red but appears yellow in the co-localization image). Scale bars = 10μm in all panels. b Overview of Iba1 staining of microglia (green) in the CA3 hippocampal region of control, anti-aggregant TauRDΔKPP and pro-aggregant TauRDΔK slices (scale bar 50μm). The controls and anti-aggregant TauRDΔKPP slices show ramified morphology of microglia whereas the pro-aggregant TauRDΔK slices had the reactive form of microglia. c Quantification of the number of Iba1 positive microglial cells in control, anti-aggregant TauRDΔKPP and pro-aggregant TauRDΔK slices at DIV30. All the Iba1 positive microglia were counted manually (as circled in the figure) by ImageJ. There was a reduction by 50% in the number of microglia in the anti-aggregant TauRDΔKPP slices at DIV30 compared to age-matched controls. By contrast, pro-aggregant TauRDΔK slices showed a massive increase of up to 100% in microglial number. Results are given as mean ±SEM of 10 animals and 4-6 slices per animal. Data were analyzed by Student's t-test., **p<0.01, ***p<0.001 and ****p<0.0001. d Quantification of the number of branches in microglia in control, anti-aggregant TauRDΔKPP and pro-aggregant TauRDΔK slices at DIV30. The branches were counted manually using the ImageJ software. The controls and the anti-aggregant TauRDΔKPP microglia showed 6-7 branches on average. By contrast, the pro-aggregant TauRDΔK microglia showed only 2-3 branches compared to the age-matched controls. Results are given as mean ±SEM of 10 animals and 4-6 slices per animal. Data were analyzed by Student's t-test ****p<0.0001 compared to control slices
Fig. 4
Fig. 4
Decrease of hypertrophic astrocytes in anti-aggregant TauRDΔKPP slices but no changes in the global GFAP content. a OHSCs from controls, anti-aggregant TauRDΔKPP and pro-aggregant TauRDΔK P8 pups were prepared and cultured until DIV30. Slices were stained with GFAP antibody (green) to label astrocytes. The control slices at DIV30 showed star-shaped astrocytes (left). In anti-aggregant TauRDΔKPP slices the astrocytes have smaller cell bodies and long, thin processes (middle). By contrast, pro-aggregant TauRDΔK slices showed hypertrophic astrocytes (right) with fewer processes which are typical of neurodegeneration. b Biochemical analysis of GFAP protein levels. Protein extracts from OHSCs of control, anti-aggregant TauRDΔKPP and pro-aggregant TauRDΔK slices at DIV30 were subjected to western blot (loading 3μg/lane) to analyze for GFAP protein levels. c Quantification of the western blots showing that the GFAP protein contents of the three samples are similar. Results are given as mean ±SEM of 4-6 slices per mice and 5-6 mice and represent the ratio between GFAP and actin levels. Data were analyzed by Student's t-test
Fig. 5
Fig. 5
Increased endogenous Tau in anti-aggregant TauRD∆KPP slices at DIV30. a OHSCs from control, anti-aggregant TauRDΔKPP and pro-aggregant TauRDΔK P8 pups were cultured until DIV30. Slices were stained with K9JA (pan Tau antibody) for the distribution of Tau. The control and the anti-aggregant TauRDΔKPP slices show uniform axonal distribution of Tau as detected by K9JA. By contrast the pro-aggregant TauRDΔK slice shows mislocalization of Tau into the somato-dendritic compartment, most prominently in the CA3 region (arrows). b Tau levels at DIV30: Protein extracts from OHSCs of controls, anti-aggregant TauRDΔKPP and pro-aggregant TauRDΔK slices were analyzed by western blotting using Tau antibody K9JA (loading 3μg/lane). c Quantification of the western blot showed a 80%increase in the amount of mouse Tau (by K9JA staining) in the anti-aggregant Tau RD∆KPP slice cultures when compared to the controls. There was a 20% reduction in the amount of Tau observed between the pro-aggregant Tau RD∆K and the control slices. Results are given as mean ±SEM of 10 animals and 3 slices per animal and represent the ratio between immunolabelled Tau and actin levels, obtained by densitometry analysis of western blots. Data were analyzed by Student's t test. *p<0.05, ***p<0.001 and ****p<0.0001 compared to control slices
Fig. 6
Fig. 6
Proliferation assay in slice cultures. BrdU (50μM) was applied from DIV15 of the culturing period until DIV30 and refreshed at every culture media change. The slices were fixed with 4% formaldehyde and immunostained by anti-BrdU antibody. a Representative image of BrdU positive cells in the hippocampal CA3 region in the controls, anti-aggregant TauRDΔKPP and pro-aggregant TauRDΔK slices. BrdU positive proliferating cells were observed in the CA1, CA3 and the DG regions of the hippocampal slice cultures. The localization of these proliferating cells is not only restricted to the SGZ of the DG in OHSCs. b Quantification of the number of BrdU positive cells in the CA1, CA3 and the DG regions in the controls, anti-aggregant TauRDΔKPP and pro-aggregant TauRDΔK slices. There is an increase in BrdU positive proliferating cells by 30% in CA1 and CA3 and 100% increase in DG region in the anti-aggregant TauRDΔKPP slices (pink bars). Note that the pro-aggregant TauRDΔK slices do not show a significant difference in the number of BrdU positive cells (blue bars) compared to that of the controls (grey bars). All the BrdU positive cells were counted blindly and manually using the ImageJ software. Results are shown as mean ±SEM of 10 animals and 4-6 slices per animal. Data was analyzed by Student's t test. *p<0.05 and ****p<0.0001 compared to controls
Fig. 7
Fig. 7
Switching-off the expression of mutant Tau. 2μM DOX was applied to the culture media of the slices to switch-off the expression of the exogenous human Tau constructs from DIV15 to DIV30. Bioluminescence was done after the DOX application on the slice cultures to make sure that there is no further expression of the anti-aggregant TauRDΔKPP during the subsequent culturing period. Results show the mean ±SEM of 10 animals, 4-6 slices per animal. Data was analyzed by Student's t test. *p<0.05 and **p<0.01 compared to switch-ON and switch-OFF conditions. a Graph representing the number of BrdU positive proliferating cells in the control and anti-aggregant TauRDΔKPP OHSCs before DOX application (switch-ON) and after (switch-OFF). There was a reduction of 32% in CA1, 27% in CA3 region and 33% in DG region in the number of BrdU positive cells in the DOX treated anti-aggregant TauRDΔKPP slices compared to the untreated anti-aggregant TauRDΔKPP slices (see pink open vs. hatched bars). This reduction parallels the decrease in the number of neurons in DOX-treated anti-aggregant TauRDΔKPP groups (see b). b Graph representing the number of NeuN positive neurons per counting frame, in the control and anti-aggregant TauRDΔKPP OHSCs before DOX application (switch-ON) and after (switch-OFF). There was a reduction of 21% in CA1, 22% in CA3 and 37% in DG region of the hippocampus, in the number of NeuN positive mature neurons in the DOX treated anti-aggregant TauRDΔKPP slices compared to the untreated anti-aggregant TauRDΔKPP slices (see pink open vs. hatched bars). Data was analyzed by Student's t test. *p<0.05, ** p<0.01 and ****p<0.0001 compared to controls
Fig. 8
Fig. 8
Proliferation of BrdU positive cells in P8 animals. P8 animals were given intra-peritoneal injections (i.p) of BrdU (50mg/kg body weight) 2 hours before sacrifice. The whole brain was cut into 30μM thick vibratome sections and slices were stained for neurons (NeuN), Tau (K9JA) and BrdU (BrdU antibody). a Representative images of NeuN (green), K9JA (red) and BrdU (cyan) staining in the CA1, CA3 and DG areas of the hippocampus of P8 control and anti-aggregant TauRD∆KPP mice. Scale bar 50μm. b Number of BrdU positive cells was counted by stereology. An increase (80%) was observed in the CA3 region in the anti-aggregant TauRDΔKPP pups compared to controls (compare bars 3, 4). Data were analyzed by Student's t test. *p<0.05 compared to controls. c Volume of the hippocampus in control and anti-aggregant TauRDΔKPP P8 pups. An increase in the volume of the hippocampus (25%) was observed in anti-aggregant TauRDΔKPP animals. The values determined are the apparent volumes of hippocampus. Results show the mean ±SEM (n= 3-5 animals/group) and data were analyzed by Student's t test. *p<0.05 compared to controls
Fig. 9
Fig. 9
Analysis of hippocampal volume and neuronal numbers in old mice (16 months). a Stereological analysis of the apparent volume of the hippocampus, b number of NeuN positive neurons and c density of the neurons in the CA1, CA3 and DG regions of the hippocampus. The analysis was done on 16 month old animal brains from the control mice, anti-aggregant TauRDΔKPP mice, and pro-aggregant TauRDΔK mice. a, b There was an increase (~15%) of the hippocampal volume in the old-aged animals from the anti-aggregant TauRDΔKPP mice compared to the age-matched controls. This correlates with an increase of neurons (~20%) in the CA3 region, b, bar 5). By contrast, in pro-aggregant old mice the volume decreases 25% relative to controls (a, bar 3); this correlates well with the 10-50% loss of neurons in all regions (b, bars 3, 6, 9). c The density of neurons per mm3 was similar in controls, anti-aggregant and pro-aggregant old mice. Results represent the mean ±SEM (n= 3-5 animals/group)
Fig. 10
Fig. 10
Identification of molecular signaling pathways affected by Tau. At DIV30, hippocampal tissue extracts from OHSCs of control and anti-aggregant TauRDΔKPP slices, without DOX (switch-ON) and with DOX (switch-OFF) were subjected to western blot analysis of Wnt5a, Wnt3, and Tau (K9JA). Results show the mean ±SEM of 4-6 slices per animal and 6-8 animals per condition and represent the ratio between the analyzed protein and actin levels. Quantification was obtained by densitometry and analyzed by Student's t test. **p<0.01 and ***p<0.001. a There was a significant decrease (50%) in the level of Wnt5a in the anti-aggregant TauRDΔKPP slices compared to the controls (bar 1, 2). When the expression of anti-aggregant TauRD∆KPP was switched off by addition of DOX from DIV15 to DIV30, the levels of Wnt5a in the anti-aggregant TauRDΔKPP slices were further reduced by 30% (bar 3). b There was an increase (85%) in the Wnt3 levels in the anti-aggregant TauRDΔKPP slice cultures compared to control slices (bar 1, 2). There was a pronounced reduction (40% below the control levels) when the expression of anti-aggregant TauRD∆KPP was switched off from DIV15 to DIV30 (bar 3). c There was 80% increase in the Tau levels as detected by the pan Tau antibody K9JA in the anti-aggregant TauRDΔKPP slice cultures (bar 2). When the expression of anti-aggregant TauRDΔKPP was switched off from DIV15 to DIV30 the Tau level was reduced by 40% to that in the controls (bar 3)
Fig. 11
Fig. 11
Hippocampal volume vs. age. Comparison of hippocampal volumes at P8, 3 months and 16 months of age, normalized to control =100% at each age (grey-control mice; pink- anti-aggregant mice and blue- pro-aggregant mice). The volumes of the anti-aggregant mice are higher than controls and those of the pro-aggregant mice are lower than the controls. Results represents the mean ±SEM (n= 3-5 animals/group) and data were analyzed by Student's t test. *p<0.05 compared to controls

References

    1. Altman J, Bayer SA. Migration and distribution of two populations of hippocampal granule cell precursors during the perinatal and postnatal periods. J Comp Neurol. 1990;301:365–381. doi: 10.1002/cne.903010304. - DOI - PubMed
    1. Anderson K, Fugaccia I, SW S. Fluoro-jade B stains quiescent and reactive astrocytes in the rodent spinal cord. J Neurotrauma. 2003;20:1223–1231. doi: 10.1089/089771503770802899. - DOI - PubMed
    1. Angelo M, Plattner F, Irvine EE, Giese KP. Improved reversal learning and altered fear conditioning in transgenic mice with regionally restricted p25 expression. Eur J Neurosci. 2003;18:423–431. doi: 10.1046/j.1460-9568.2003.02746.x. - DOI - PubMed
    1. Apostolova LG, Green AE, Babakchanian S, Hwang KS, Chou YY, Toga AW, Thompson PM. Hippocampal atrophy and ventricular enlargement in normal aging, mild cognitive impairment (MCI), and Alzheimer Disease. Alzheimer Dis Assoc Disord. 2012;26:17–27. doi: 10.1097/WAD.0b013e3182163b62. - DOI - PMC - PubMed
    1. Barkho BZ, Song H, Aimone JB, Smrt RD, Kuwabara T, Nakashima K, Gage FH, Zhao X. Identification of astrocyte-expressed factors that modulate neural stem/progenitor cell differentiation. Stem Cells Dev. 2006;15:407–421. doi: 10.1089/scd.2006.15.407. - DOI - PMC - PubMed

Publication types

MeSH terms

LinkOut - more resources