

Granatum: a graphical single-cell RNA-Seq analysis pipeline for genomics scientists
- PMID: 29202807
- PMCID: PMC5716224
- DOI: 10.1186/s13073-017-0492-3
Granatum: a graphical single-cell RNA-Seq analysis pipeline for genomics scientists
Abstract
Background: Single-cell RNA sequencing (scRNA-Seq) is an increasingly popular platform to study heterogeneity at the single-cell level. Computational methods to process scRNA-Seq data are not very accessible to bench scientists as they require a significant amount of bioinformatic skills.
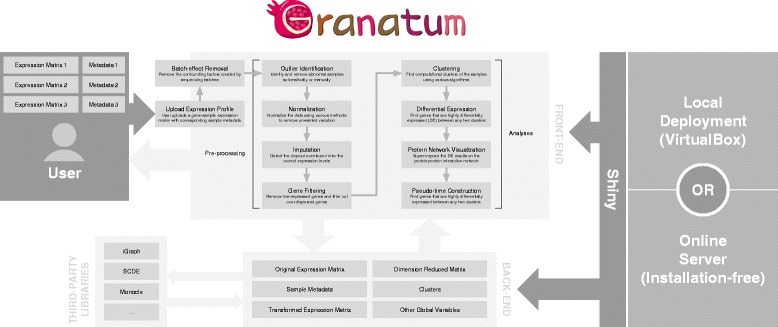
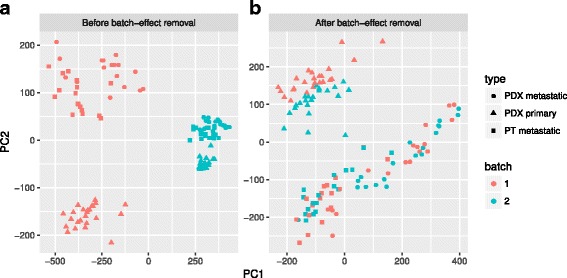
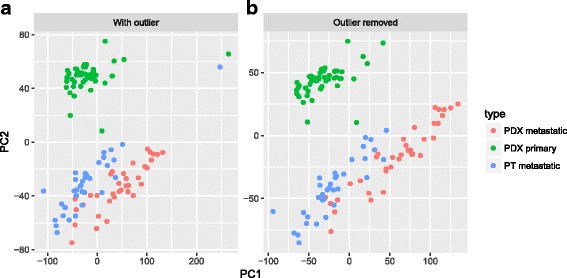
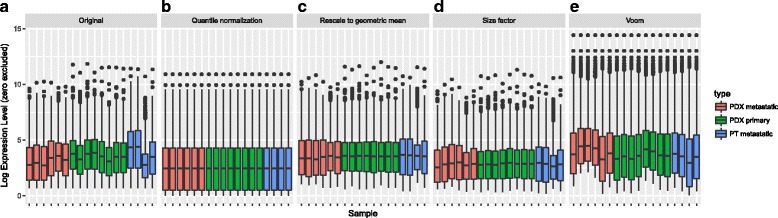
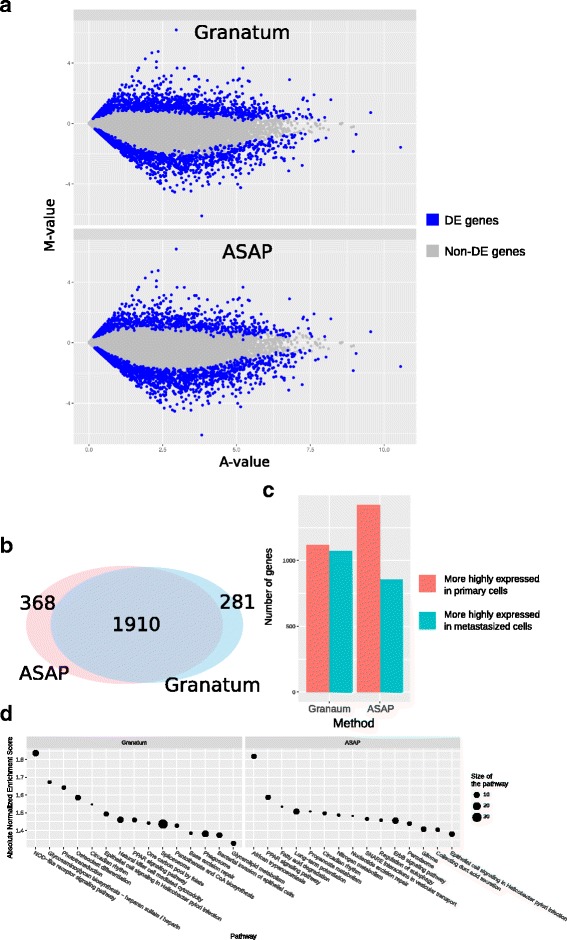
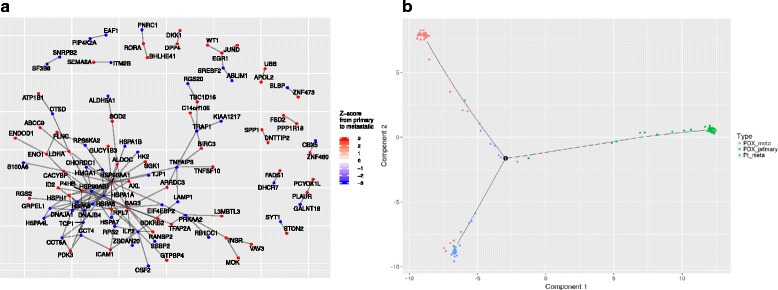
Results: We have developed Granatum, a web-based scRNA-Seq analysis pipeline to make analysis more broadly accessible to researchers. Without a single line of programming code, users can click through the pipeline, setting parameters and visualizing results via the interactive graphical interface. Granatum conveniently walks users through various steps of scRNA-Seq analysis. It has a comprehensive list of modules, including plate merging and batch-effect removal, outlier-sample removal, gene-expression normalization, imputation, gene filtering, cell clustering, differential gene expression analysis, pathway/ontology enrichment analysis, protein network interaction visualization, and pseudo-time cell series construction.
Conclusions: Granatum enables broad adoption of scRNA-Seq technology by empowering bench scientists with an easy-to-use graphical interface for scRNA-Seq data analysis. The package is freely available for research use at http://garmiregroup.org/granatum/app.
Keywords: Clustering; Differential expression; Gene expression; Graphical; Imputation; Normalization; Pathway; Pseudo-time; Single-cell; Software.
Conflict of interest statement
Ethics approval and consent to participate
Not sapplicable.
Consent for publication
Not applicable.
Competing interests
The authors declare that they have no competing interests.
Publisher’s Note
Springer Nature remains neutral with regard to jurisdictional claims in published maps and institutional affiliations.
Figures
Similar articles
-
GranatumX: A Community-engaging, Modularized, and Flexible Webtool for Single-cell Data Analysis.Genomics Proteomics Bioinformatics. 2021 Jun;19(3):452-460. doi: 10.1016/j.gpb.2021.07.005. Epub 2021 Dec 30. Genomics Proteomics Bioinformatics. 2021. PMID: 34973417 Free PMC article.
-
Shaoxia: a web-based interactive analysis platform for single cell RNA sequencing data.BMC Genomics. 2024 Apr 24;25(1):402. doi: 10.1186/s12864-024-10322-1. BMC Genomics. 2024. PMID: 38658838 Free PMC article.
-
ascend: R package for analysis of single-cell RNA-seq data.Gigascience. 2019 Aug 1;8(8):giz087. doi: 10.1093/gigascience/giz087. Gigascience. 2019. PMID: 31505654 Free PMC article.
-
scRNA-seq data analysis method to improve analysis performance.IET Nanobiotechnol. 2023 May;17(3):246-256. doi: 10.1049/nbt2.12115. Epub 2023 Feb 2. IET Nanobiotechnol. 2023. PMID: 36727937 Free PMC article. Review.
-
A guide to single-cell RNA sequencing analysis using web-based tools for non-bioinformatician.FEBS J. 2024 Jun;291(12):2545-2561. doi: 10.1111/febs.17036. Epub 2024 Jan 20. FEBS J. 2024. PMID: 38148322 Review.
Cited by
-
GranatumX: A Community-engaging, Modularized, and Flexible Webtool for Single-cell Data Analysis.Genomics Proteomics Bioinformatics. 2021 Jun;19(3):452-460. doi: 10.1016/j.gpb.2021.07.005. Epub 2021 Dec 30. Genomics Proteomics Bioinformatics. 2021. PMID: 34973417 Free PMC article.
-
Single cell transcriptome research in human placenta.Reproduction. 2020 Dec;160(6):R155-R167. doi: 10.1530/REP-20-0231. Reproduction. 2020. PMID: 33112783 Free PMC article. Review.
-
DIscBIO: A User-Friendly Pipeline for Biomarker Discovery in Single-Cell Transcriptomics.Int J Mol Sci. 2021 Jan 30;22(3):1399. doi: 10.3390/ijms22031399. Int J Mol Sci. 2021. PMID: 33573289 Free PMC article.
-
Data normalization for addressing the challenges in the analysis of single-cell transcriptomic datasets.BMC Genomics. 2024 May 6;25(1):444. doi: 10.1186/s12864-024-10364-5. BMC Genomics. 2024. PMID: 38711017 Free PMC article. Review.
-
Toward uncharted territory of cellular heterogeneity: advances and applications of single-cell RNA-seq.J Transl Genet Genom. 2021;5:1-21. doi: 10.20517/jtgg.2020.51. Epub 2021 Jan 1. J Transl Genet Genom. 2021. PMID: 34322662 Free PMC article.
References
-
- Brennecke P, Anders S, Kim JK, Kołodziejczyk AA, Zhang X, Proserpio V, et al. Accounting for technical noise in single-cell RNA-seq experiments. Nat. Methods. 2013;10:1093–5. - PubMed
MeSH terms
Grants and funding
- P20 COBRE GM103457/National Institute of General Medical Sciences (US)
- R01 LM012373/LM/NLM NIH HHS/United States
- R01HD084633/National Institute of Child Health and Human Development (US)
- R01LM012373/U.S. National Library of Medicine
- K01ES025434/National Institute of Environmental Health Sciences (US)
LinkOut - more resources
Full Text Sources
Other Literature Sources
