. 2017 Dec 4;6(1):163.
doi: 10.1186/s40249-017-0377-0.

Sensitive detection of HIV-1 resistance to Zidovudine and impact on treatment outcomes in low- to middle-income countries

Affiliations

Sensitive detection of HIV-1 resistance to Zidovudine and impact on treatment outcomes in low- to middle-income countries

Richard M Gibson et al. Infect Dis Poverty. .

Abstract

Background: Thymidine analogs, namely AZT (Zidovudine or Retrovir™) and d4T (Stavudine or Zerit™) are antiretroviral drugs still employed in over 75% of first line combination antiretroviral therapy (cART) in Kampala, Uganda despite aversion to prescribing these drugs for cART in high income countries due in part to adverse events. For this study, we explored how the continued use of these thymidine analogs in cART could impact emergence of drug resistance and impact on future treatment success in Uganda, a low-income country.

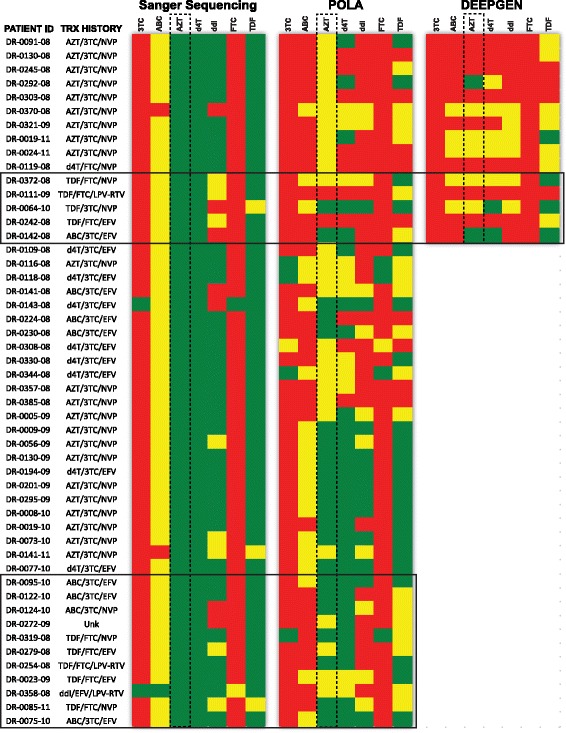
Methods: We examined the drug resistance genotypes by Sanger sequencing of 262 HIV-infected patients failing a first line combined antiretroviral treatment containing either AZT or d4T, which represents approximately 5% of the patients at the Joint Clinical Research Center receiving a AZT or d4T containing treatment. Next generation sequencing (DEEPGEN™HIV) and multiplex oligonucleotide ligation assays (AfriPOLA) were then performed on a subset of patient samples to detect low frequency drug resistant mutations. CD4 cell counts, viral RNA loads, and treatment changes were analyzed in a cohort of treatment success and failures.

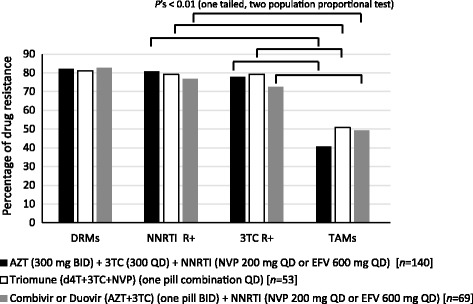
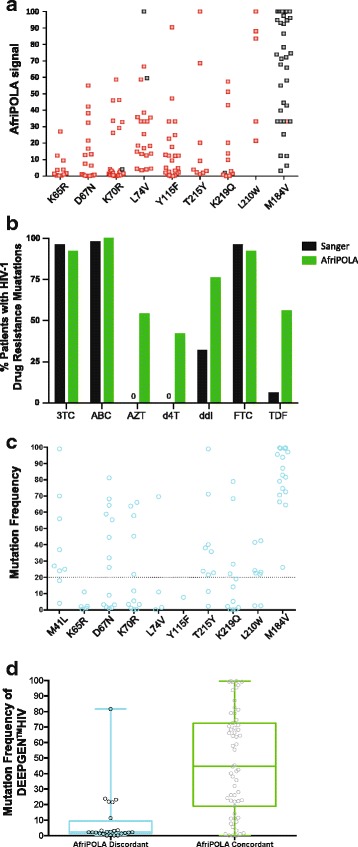
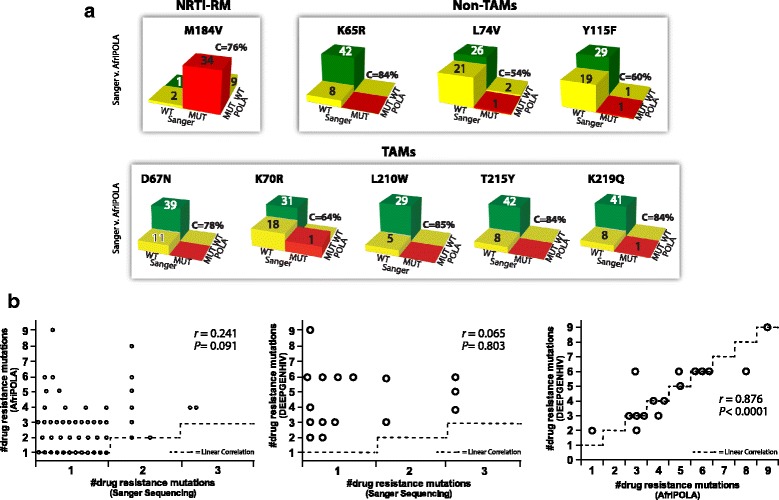
Results: Over 80% of patients failing first line AZT/d4T-containing cART had predicted drug resistance to 3TC (Lamivudine) and non-nucleoside RT inhibitors (NNRTIs) in the treatment regimen but only 45% had resistance AZT/d4T associated resistance mutations (TAMs). TAMs were however detected at low frequency within the patients HIV quasispecies (1-20%) in 21 of 34 individuals who were failing first-line AZT-containing cART and lacked TAMs by Sanger. Due to lack of TAMs by Sanger, AZT was typically maintained in second-line therapies and these patients had a low frequency of subsequent virologic success.

Conclusions: Our findings suggest that continued use of AZT and d4T in first-line treatment in low-to-middle income countries may lead to misdiagnosis of HIV-1 drug resistance and possibly enhance a succession of second- and third-line treatment failures.

Keywords: Antiretroviral treatment; Drug resistance; Uganda.


Conflict of interest statement

Ethics approval and consent to participate

Clinical and virological data were obtained from patient care database at the JCRC under IRB approval (EM10-07) for HIV-1 drug resistance testing.

Consent for publication

Not applicable

Competing interests

E.J.A developed and patented the technology used in AfriPOLA. R.M.G and M.E.Q-M developed DEEPGEN™HIV. There are no further patents, products in development or marketed products to declare.

Figures

Fig. 1
Fig. 1
Appearance of drug resistance mutations upon treatment failure in Uganda patients receiving first line cART. The Joint Clinical Research Centre treats over 15 000 HIV infected patients in Kampala, Uganda. As standard-of-care, patients are provided drug resistance testing upon evidence of treatment failure (plasma HIV-1 RNA load above 2000 copies/ml and/or CD4+ T-cell counts below 250 cells/ml). The drug resistance tests are performed with an in-house Sanger sequencing assay in a WHO-certified laboratory. Test results are stored in an anonymized database under IRB approval. Graph shows percentages of patients failing one of three first line cART regimens with any primary drug resistance mutations (DRMs), with an NNRTI resistant mutation (NNRTI R+), with a 3TC resistance mutation (3TC R+), and with thymidine analog resistance mutations (TAMs)
Fig. 2
Fig. 2
Detection of TAM using AfriPOLA or DEEPGEN™HIV. a Relative mean fluorescence intensity (MFI) from each patient represented as percent of max value (MFI; calculated for ≥150 beads per well; +/− s.d.; N = 3 independent experiments). The maximal MFI for detection of any of the 9 mutations probed by AfriPOLA. Red dots indicate mutations not detected by Sanger sequencing. b Percent of patients within cohort (Table 1) with drug resistance to the indicated drugs based on genotype from AfriPOLA and Sanger sequencing. c Mutation frequency ≥1% for TAMs (M41 L, K65R, D67N, K70R, L74 V, Y115F, T215Y, K219Q, L210 W, and M184 V) as detected by DEEPGEN™HIV in each patient (Table 1). Previous studies have established DEEPGEN™HIV error rate, reproducibility and sensitivity [37]. d Box plot comparing DEEPGEN™HIV mutation frequency for all TAMs to AfriPOLA concordant and discordant result
Fig. 3
Fig. 3
HIV-1 genotypic resistance interpretation for Sanger, AfriPOLA, and DEEPGEN™HIV. pol-PR/RT sequences were submitted to the HIVdb Program Genotypic Resistance Interpretation Algorithm from the Stanford University HIV Drug Resistance Database (http://hivdb.stanford.edu) to determine patient susceptibility to reverse transcriptase inhibitors. Color codes indicate High-level (red), intermediate (yellow) or susceptible (green) resistance report. All 50 patients from Table 1 are reported and organized by which drug resistance method was conducted Sanger, AfriPOLA, and/or DEEPGENHIV. Proposed sensitivity to NRTIs (3TC, ABC, AZT, d4T, ddI, FTC, and TDF) are shown
Fig. 4
Fig. 4
Concordance Analysis of Sanger genotyping, AfriPOLA, and DEEPGEN™HIV. a 3D chi square tables display the concordance, Sanger v. AfriPOLA, for each site interrogated. Bar color represents: green bars indicate concordance for WT allele, red bars indicate concordance for mutant allele, yellow bars indicate discordance. b Concordance analysis comparing number of drug resistance mutations reported by each method. Pearson correlation coefficient (r) and statistical significance (p) reported on each graph. Dashed line indicates exact linear correlation
Fig. 5
Fig. 5
Patient HIV-1 RNA Load and CD4+ T Cell Count Receiving First Line Treatment Pre/Post Sanger Resistance Testing. a Patients (n = 157) at the time of Sanger DR testing with resistance to AZT. b AZT susceptible patients (n = 99) at the the time of Sanger DR testing. c Patients (n = 39) resistant to AZT by AfriPOLA. Means and statistically significant differences (ANOVA) are indicated

Similar articles

Cited by

References

    1. UNAIDS. The HIV and AIDS Uganda Country Progress Report 2014. Geneva, Switzerland. 2014; http://www.unaids.org/sites/default/files/country/documents/UGA_narrativ....
    1. Paredes R, Clotet B. Clinical management of HIV-1 resistance. Antivir Res. 2010;85:245–265. doi: 10.1016/j.antiviral.2009.09.015. - DOI - PubMed
    1. Zolopa AR. The evolution of HIV treatment guidelines: current state-of-the-art of ART. Antivir Res. 2010;85:241–244. doi: 10.1016/j.antiviral.2009.10.018. - DOI - PubMed
    1. Cohen J. Breakthrough of the year. HIV treatment as prevention. Science. 2011;334:1628. doi: 10.1126/science.334.6063.1628. - DOI - PubMed
    1. Menendez-Arias L. Molecular basis of human immunodeficiency virus type 1 drug resistance: overview and recent developments. Antivir Res. 2013;98:93–120. doi: 10.1016/j.antiviral.2013.01.007. - DOI - PubMed

MeSH terms