Application of two-parameter scoliometer values for predicting scoliotic Cobb angle
- PMID: 29202876
- PMCID: PMC5716015
- DOI: 10.1186/s12938-017-0427-7
Application of two-parameter scoliometer values for predicting scoliotic Cobb angle
Abstract
Background: Adolescent idiopathic scoliosis, in which obvious curves are visible in radiographic images, is also seen in combination with lumps in the back. These lumps contribute to inclination, which can be measured by a scoliometer. To the authors' knowledge, there are no previous formulas combining thoracic and lumbar scoliometer values simultaneously to predict thoracic and lumbar Cobb angles, respectively. This study aimed to create more accurate two-parameter mathematical formulas for predicting thoracic and lumbar Cobb angles.
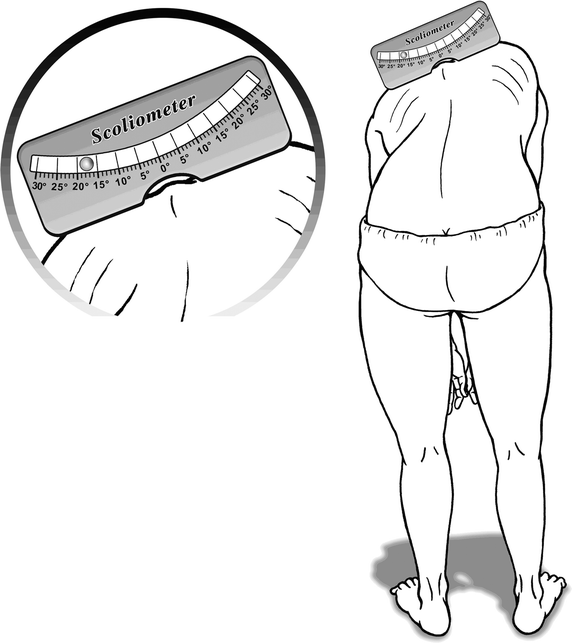
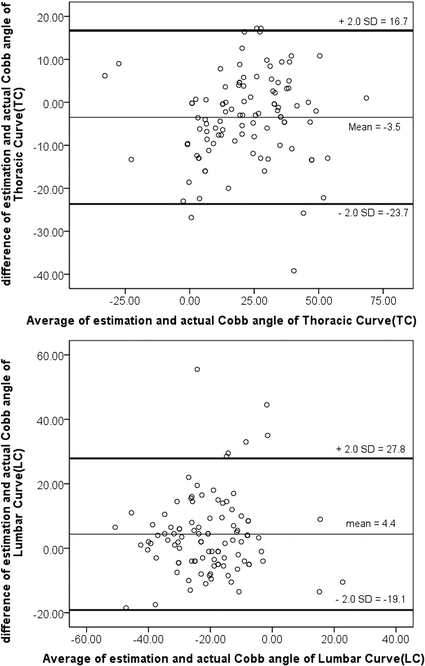
Methods: Between Dec. 2012 and Jan. 2013, patients diagnosed with idiopathic scoliosis in an outpatient clinic were enrolled. The maximal trunk rotations at the thoracic and lumbar regions were recorded with a scoliometer. Right asymmetry hump was deemed positive (+), and left asymmetry hump was deemed negative (-). The Cobb angles were measured with a Picture Archiving and Communication System. Statistical analysis included Pearson's correlation coefficient, multivariate regression and Bland-Atman analysis.
Results: One-hundred and one patients were enrolled in our study. The average thoracic curve (TC) was 23.3 ± 1.8°, while the average lumbar curve (LC) was - 23.3 ± 1.4°. The thoracic inclination (TI) and lumbar inclination (LI) were 4.5 ± 0.7 and - 5.9 ± 0.6, respectively. The one-parameter formula for the thoracic curve was TC = 2.0 TI + 14.3 (r = 0.813); for the lumbar curve, it was LC = 0.9 LI - 16.9 (r = 0.409). By multivariate regression, the two-parameter formulas for the thoracic and lumbar curves were TC = 2.6 TI - 1.4 LI (r = 0.931) and LC = - 1.5 TI + 2.0 LI (r = 0.874), respectively. The two-parameter formulas were more accurate than the one-parameter formulas.
Conclusions: Based on the results of these two-parameter formulas for thoracic and lumbar curves, the Cobb angles can be predicted more accurately by the readings of the scoliometer. Physicians and other healthcare practitioners can thus evaluate patients with scoliosis more precisely than before with a scoliometer.
Keywords: Cobb angle; Idiopathic scoliosis; Nash–Moe rotation; Rib hump; Scoliometer.
Figures


Similar articles
-
Prediction of scoliotic cobb angle with the use of the scoliometer.Spine (Phila Pa 1976). 1996 Jul 15;21(14):1661-6. doi: 10.1097/00007632-199607150-00010. Spine (Phila Pa 1976). 1996. PMID: 8839469
-
Prediction of Cobb angle in idiopathic adolescent scoliosis.Clin Orthop Relat Res. 2003 Jun;(411):32-9. doi: 10.1097/01.blo.0000068360.47147.30. Clin Orthop Relat Res. 2003. PMID: 12782857
-
Short anterior correction of the thoracolumbar/lumbar curve in King 1 idiopathic scoliosis: the behaviour of the instrumented and non-instrumented curves and the trunk balance.Eur Spine J. 2007 Jan;16(1):65-72. doi: 10.1007/s00586-006-0075-2. Epub 2006 Mar 17. Eur Spine J. 2007. PMID: 16544158 Free PMC article.
-
Idiopathic scoliosis caused by a short spinal cord.Acta Radiol Diagn (Stockh). 1968 May;7(3):257-71. doi: 10.1177/028418516800700308. Acta Radiol Diagn (Stockh). 1968. PMID: 4883824 Review. No abstract available.
-
Moiré topography as a screening and diagnostic tool-A systematic review.PLoS One. 2021 Dec 2;16(12):e0260858. doi: 10.1371/journal.pone.0260858. eCollection 2021. PLoS One. 2021. PMID: 34855885 Free PMC article.
Cited by
-
Assessment of reliability and validity of a handheld surface spine scanner for measuring trunk rotation in adolescent idiopathic scoliosis.Spine Deform. 2023 Nov;11(6):1347-1354. doi: 10.1007/s43390-023-00737-3. Epub 2023 Jul 26. Spine Deform. 2023. PMID: 37493936 Free PMC article.
-
Impact of postural variations on trunk rotation angle during the forward bending test in adolescents idiopathic scoliosis.Spine Deform. 2025 May;13(3):673-679. doi: 10.1007/s43390-024-01018-3. Epub 2024 Dec 17. Spine Deform. 2025. PMID: 39690294
-
The effectiveness of Schroth exercises added to the brace on the postural control of adolescents with idiopathic scoliosis: Case series.Ann Med Surg (Lond). 2022 Nov 13;84:104893. doi: 10.1016/j.amsu.2022.104893. eCollection 2022 Dec. Ann Med Surg (Lond). 2022. PMID: 36536721 Free PMC article.
-
The effectiveness of two different exercise approaches in adolescent idiopathic scoliosis: A single-blind, randomized-controlled trial.PLoS One. 2021 Apr 15;16(4):e0249492. doi: 10.1371/journal.pone.0249492. eCollection 2021. PLoS One. 2021. PMID: 33857180 Free PMC article. Clinical Trial.
-
Effects of physiotherapeutic scoliosis-specific exercise in patients with mild juvenile scoliosis.BMC Musculoskelet Disord. 2022 Oct 15;23(1):918. doi: 10.1186/s12891-022-05857-x. BMC Musculoskelet Disord. 2022. PMID: 36243704 Free PMC article.
References
-
- Goldberg CJ, Grove D, Moore DP, Fogarty EE, Dowling FE. Surface topography and vectors: a new measure for the three dimensional quantification of scoliotic deformity. Stud Health Technol Inform. 2006;123:449–455. - PubMed
-
- Lim CH, Tassone C, Liu XC, Thometz JG, Lyon R. Correlation of idiopathic scoliosis assessments between newly developed Milwaukee Topographic Scanner and Quantec. Stud Health Technol Inform. 2012;176:255–258. - PubMed
MeSH terms
LinkOut - more resources
Full Text Sources
Other Literature Sources
Medical
Research Materials

