

Admixture mapping of uterine fibroid size and number in African American women
- PMID: 29202956
- PMCID: PMC5728674
- DOI: 10.1016/j.fertnstert.2017.09.018
Admixture mapping of uterine fibroid size and number in African American women
Abstract
Objective: To evaluate the relationship between genetic ancestry and uterine fibroid characteristics.
Design: Cross-sectional study.
Setting: Not applicable.
Patient(s): A total of 609 African American participants with image- or surgery-confirmed fibroids in a biorepository at Vanderbilt University electronic health record biorepository and the Coronary Artery Risk Development in Young Adults studies were included.
Intervention(s): None.
Main outcome measure(s): Outcome measures include fibroid number (single vs. multiple), volume of largest fibroid, and largest fibroid dimension of all fibroid measurements.
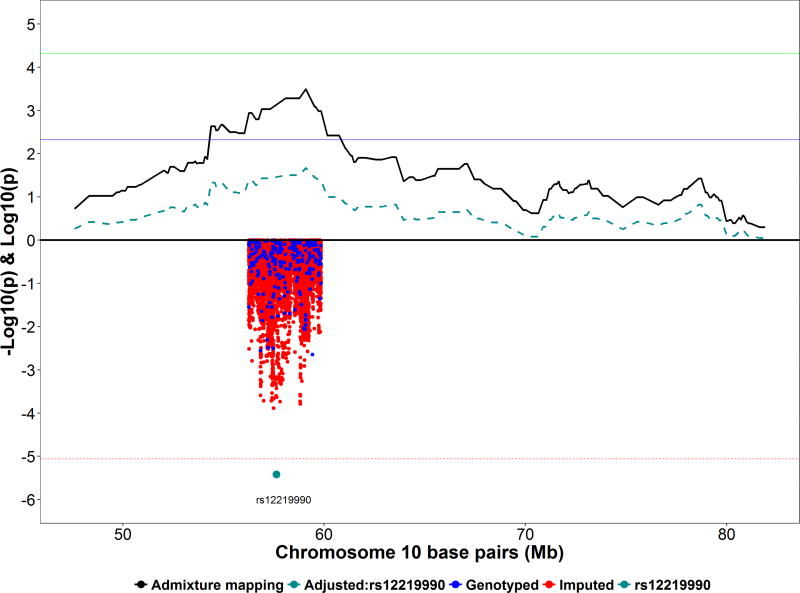
Result(s): Global ancestry meta-analyses revealed a significant inverse association between percentage of European ancestry and risk of multiple fibroids (odds ratio: 0.78; 95% confidence interval 0.66, 0.93; P=6.05 × 10⁻³). Local ancestry meta-analyses revealed five suggestive (P<4.80 × 10⁻³) admixture mapping peaks in 2q14.3-2q21.1, 3p14.2-3p14.1, 7q32.2-7q33, 10q21.1, 14q24.2-14q24.3, for number of fibroids and one suggestive admixture mapping peak (P<1.97 × 10⁻³) in 10q24.1-10q24.32 for volume of largest fibroid. Single variant association meta-analyses of the strongest associated region from admixture mapping of fibroid number (10q21.1) revealed a strong association at single nucleotide polymorphism variant rs12219990 (odds ratio: 0.41; 95% confidence interval 0.28, 0.60; P=3.82 × 10⁻⁶) that was significant after correction for multiple testing.
Conclusion(s): Increasing African ancestry is associated with multiple fibroids but not with fibroid size. Local ancestry analyses identified several novel genomic regions not previously associated with fibroid number and increasing volume. Future studies are needed to explore the genetic impact that ancestry plays into the development of fibroid characteristics.
Keywords: Fibroids; admixture mapping; global ancestry; leiomyomata; local ancestry.
Copyright © 2017 American Society for Reproductive Medicine. Published by Elsevier Inc. All rights reserved.
Conflict of interest statement
The authors have no conflicts of interest to disclose.
Figures
References
-
- Vollenhoven B. Introduction: the epidemiology of uterine leiomyomas. Bailliere's clinical obstetrics and gynaecology. 1998;12:169–76. - PubMed
-
- Baird DD, Dunson DB, Hill MC, Cousins D, Schectman JM. High cumulative incidence of uterine leiomyoma in black and white women: ultrasound evidence. American journal of obstetrics and gynecology. 2003;188:100–7. - PubMed
-
- Marshall LM, Spiegelman D, Barbieri RL, Goldman MB, Manson JE, Colditz GA, et al. Variation in the incidence of uterine leiomyoma among premenopausal women by age and race. Obstetrics and gynecology. 1997;90:967–73. - PubMed
-
- Wilcox LS, Koonin LM, Pokras R, Strauss LT, Xia Z, Peterson HB. Hysterectomy in the United States, 1988–1990. Obstetrics and gynecology. 1994;83:549–55. - PubMed
Publication types
MeSH terms
Substances
Grants and funding
- UL1 TR000445/TR/NCATS NIH HHS/United States
- HHSN268201300026C/HL/NHLBI NIH HHS/United States
- T32 GM080178/GM/NIGMS NIH HHS/United States
- R03 HD078567/HD/NICHD NIH HHS/United States
- N01 HC065226/HC/NHLBI NIH HHS/United States
- R01 HL065611/HL/NHLBI NIH HHS/United States
- HHSN268201300025C/HL/NHLBI NIH HHS/United States
- HHSN268201300027C/HL/NHLBI NIH HHS/United States
- R01 HD074711/HD/NICHD NIH HHS/United States
- TL1 TR000447/TR/NCATS NIH HHS/United States
- UL1 TR002243/TR/NCATS NIH HHS/United States
- HHSN268201300029C/HL/NHLBI NIH HHS/United States
- N01 HC065226/HL/NHLBI NIH HHS/United States
- R01 HD093671/HD/NICHD NIH HHS/United States
- HHSN268200900041C/HL/NHLBI NIH HHS/United States
- HHSN268201300028C/HL/NHLBI NIH HHS/United States
LinkOut - more resources
Full Text Sources
Other Literature Sources
Medical
