

Personalized Prediction of Glaucoma Progression Under Different Target Intraocular Pressure Levels Using Filtered Forecasting Methods
- PMID: 29203067
- PMCID: PMC5866175
- DOI: 10.1016/j.ophtha.2017.10.033
Personalized Prediction of Glaucoma Progression Under Different Target Intraocular Pressure Levels Using Filtered Forecasting Methods
Abstract
Purpose: To generate personalized forecasts of how patients with open-angle glaucoma (OAG) experience disease progression at different intraocular pressure (IOP) levels to aid clinicians with setting personalized target IOPs.
Design: Secondary analyses using longitudinal data from 2 randomized controlled trials.
Participants: Participants with moderate or advanced OAG from the Collaborative Initial Glaucoma Treatment Study (CIGTS) or the Advanced Glaucoma Intervention Study (AGIS).
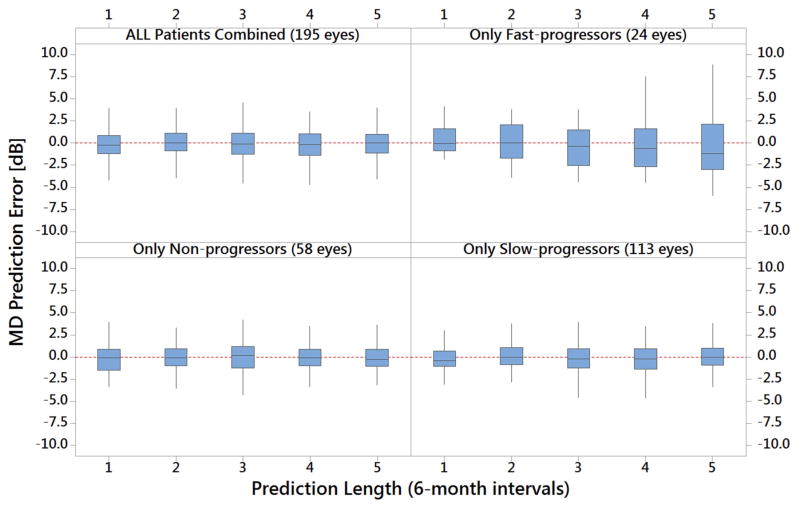
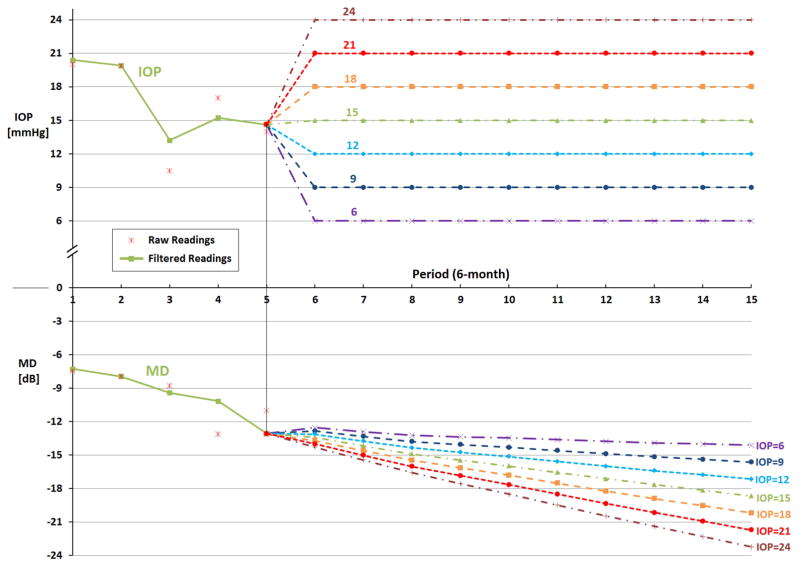
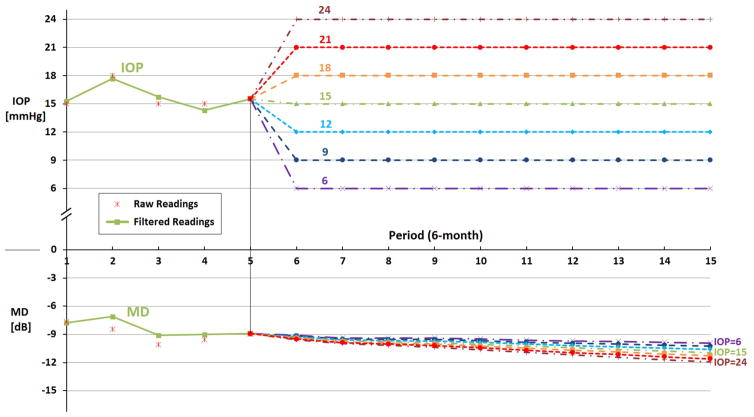
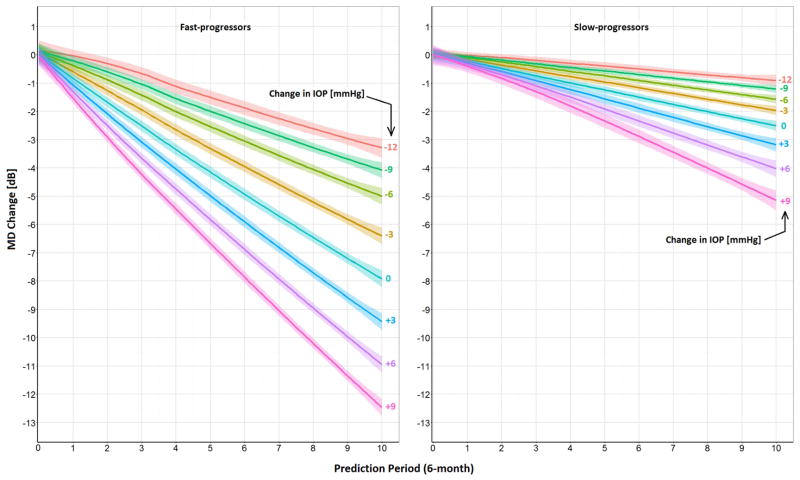
Methods: By using perimetric and tonometric data from trial participants, we developed and validated Kalman Filter (KF) models for fast-, slow-, and nonprogressing patients with OAG. The KF can generate personalized and dynamically updated forecasts of OAG progression under different target IOP levels. For each participant, we determined how mean deviation (MD) would change if the patient maintains his/her IOP at 1 of 7 levels (6, 9, 12, 15, 18, 21, or 24 mmHg) over the next 5 years. We also model and predict changes to MD over the same time horizon if IOP is increased or decreased by 3, 6, and 9 mmHg from the level attained in the trials.
Main outcome measures: Personalized estimates of the change in MD under different target IOP levels.
Results: A total of 571 participants (mean age, 64.2 years; standard deviation, 10.9) were followed for a mean of 6.5 years (standard deviation, 2.8). Our models predicted that, on average, fast progressors would lose 2.1, 6.7, and 11.2 decibels (dB) MD under target IOPs of 6, 15, and 24 mmHg, respectively, over 5 years. In contrast, on average, slow progressors would lose 0.8, 2.1, and 4.1 dB MD under the same target IOPs and time frame. When using our tool to quantify the OAG progression dynamics for all 571 patients, we found no statistically significant differences over 5 years between progression for black versus white, male versus female, and CIGTS versus AGIS participants under different target IOPs (P > 0.05 for all).
Conclusions: To our knowledge, this is the first clinical decision-making tool that generates personalized forecasts of the trajectory of OAG progression at different target IOP levels. This approach can help clinicians determine appropriate, personalized target IOPs for patients with OAG.
Copyright © 2017 American Academy of Ophthalmology. Published by Elsevier Inc. All rights reserved.
Figures
Similar articles
-
Using filtered forecasting techniques to determine personalized monitoring schedules for patients with open-angle glaucoma.Ophthalmology. 2014 Aug;121(8):1539-46. doi: 10.1016/j.ophtha.2014.02.021. Epub 2014 Apr 4. Ophthalmology. 2014. PMID: 24704136 Free PMC article.
-
Comparing Perimetric Loss at Different Target Intraocular Pressures for Patients with High-Tension and Normal-Tension Glaucoma.Ophthalmol Glaucoma. 2021 May-Jun;4(3):251-259. doi: 10.1016/j.ogla.2020.09.009. Epub 2020 Sep 17. Ophthalmol Glaucoma. 2021. PMID: 32950753 Free PMC article.
-
Intraocular pressure control and long-term visual field loss in the Collaborative Initial Glaucoma Treatment Study.Ophthalmology. 2011 Sep;118(9):1766-73. doi: 10.1016/j.ophtha.2011.01.047. Epub 2011 May 20. Ophthalmology. 2011. PMID: 21600658 Free PMC article. Clinical Trial.
-
Ab interno trabecular bypass surgery with Schlemm´s canal microstent (Hydrus) for open angle glaucoma.Cochrane Database Syst Rev. 2020 Mar 9;3(3):CD012740. doi: 10.1002/14651858.CD012740.pub2. Cochrane Database Syst Rev. 2020. PMID: 32147807 Free PMC article.
-
Selective laser trabeculoplasty versus medication for open-angle glaucoma: systematic review and meta-analysis of randomised clinical trials.Br J Ophthalmol. 2020 Nov;104(11):1500-1507. doi: 10.1136/bjophthalmol-2019-315613. Epub 2020 Feb 12. Br J Ophthalmol. 2020. PMID: 32051136
Cited by
-
Visual Field Prediction: Evaluating the Clinical Relevance of Deep Learning Models.Ophthalmol Sci. 2022 Sep 13;3(1):100222. doi: 10.1016/j.xops.2022.100222. eCollection 2023 Mar. Ophthalmol Sci. 2022. PMID: 36325476 Free PMC article.
-
Artificial intelligence and deep learning in ophthalmology.Br J Ophthalmol. 2019 Feb;103(2):167-175. doi: 10.1136/bjophthalmol-2018-313173. Epub 2018 Oct 25. Br J Ophthalmol. 2019. PMID: 30361278 Free PMC article. Review.
-
Using Kalman Filtering to Forecast Disease Trajectory for Patients With Normal Tension Glaucoma.Am J Ophthalmol. 2019 Mar;199:111-119. doi: 10.1016/j.ajo.2018.10.012. Epub 2018 Oct 16. Am J Ophthalmol. 2019. PMID: 30336130 Free PMC article.
-
Artificial intelligence in ophthalmology - Machines think!Indian J Ophthalmol. 2022 Apr;70(4):1075-1079. doi: 10.4103/ijo.IJO_644_22. Indian J Ophthalmol. 2022. PMID: 35325987 Free PMC article. No abstract available.
-
Precision medicine to prevent glaucoma-related blindness.Curr Opin Ophthalmol. 2019 May;30(3):187-198. doi: 10.1097/ICU.0000000000000564. Curr Opin Ophthalmol. 2019. PMID: 30883441 Free PMC article. Review.
References
-
- Lefferts EJ, Markley FL, Shuster MD. Kalman filtering for spacecraft attitude estimation. Journal of Guidance, Control, and Dynamics. 1982;5(5):417–29.
-
- Eberle C, Ament C. The unscented Kalman filter estimates the plasma insulin from glucose measurement. Biosystems. 2011;103(1):67–72. - PubMed
-
- Lavieri MS, Puterman ML, Tyldesley S, Morris WJ. When to treat prostate cancer patients based on their PSA dynamics. IIE Transactions on Healthcare Systems Engineering. 2012;2(1):62–77.
-
- Musch DC, Lichter PR, Guire KE, et al. The Collaborative Initial Glaucoma Treatment Study: study design, methods, and baseline characteristics of enrolled patients. Ophthalmology. 1999;106(4):653–62. - PubMed
Publication types
MeSH terms
Substances
Grants and funding
LinkOut - more resources
Full Text Sources
Other Literature Sources
Miscellaneous
