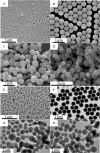
Global gene expression analysis of macrophage response induced by nonporous and porous silica nanoparticles
- PMID: 29203145
- PMCID: PMC6050981
- DOI: 10.1016/j.nano.2017.11.021
Global gene expression analysis of macrophage response induced by nonporous and porous silica nanoparticles
Abstract
Little is known about the global gene expression profile of macrophages in response to changes in size and porosity of silica nanoparticles (SNPs). Spherical nonporous SNPs of two different diameters, and mesoporous spherical SNPs with comparable size were characterized. Reactive oxygen species, mitochondrial membrane potential, lysosome degradation capacity, and lysosome pH were measured to evaluate the influence of nonporous and mesoporous SNPs on mitochondrial and lysosomal function. RNA-sequencing was utilized to generate transcriptional profiles of RAW264.7 macrophages exposed to non-toxic SNP doses. DESeq2, limma, and BinReg2 software were used to analyze the data based on both unsupervised and supervised strategies to identify genes with greatest differences among NP treatments. Utilizing GATHER and DAVID software, possible induced pathways were studied. We found that mesoporous silica nanoparticles are capable of altering gene expression in macrophages at doses that do not elicit acute cytotoxicity, while gene transcription was minimally affected by nonporous SNPs.
Keywords: Gene expression; Gene ontology; Lysosome pathway; Nanotoxicity; Reactive oxygen species; Silica nanoparticles.
Copyright © 2017 Elsevier Inc. All rights reserved.
Figures


Similar articles
-
Time- and dose-dependent gene expression analysis of macrophage response as a function of porosity of silica nanoparticles.Nanomedicine. 2019 Oct;21:102041. doi: 10.1016/j.nano.2019.102041. Epub 2019 Jun 20. Nanomedicine. 2019. PMID: 31228603
-
Extra-Large Pore Mesoporous Silica Nanoparticles for Directing in Vivo M2 Macrophage Polarization by Delivering IL-4.Nano Lett. 2017 May 10;17(5):2747-2756. doi: 10.1021/acs.nanolett.6b04130. Epub 2017 Apr 24. Nano Lett. 2017. PMID: 28422506
-
Impacts of mesoporous silica nanoparticle size, pore ordering, and pore integrity on hemolytic activity.J Am Chem Soc. 2010 Apr 7;132(13):4834-42. doi: 10.1021/ja910846q. J Am Chem Soc. 2010. PMID: 20230032
-
Effects of silica nanoparticles with varied physicochemical properties on the survival and functionality of saturated macrophages.J Control Release. 2025 May 10;381:113640. doi: 10.1016/j.jconrel.2025.113640. Epub 2025 Mar 17. J Control Release. 2025. PMID: 40107516
-
Rod-shaped mesoporous silica nanoparticles for nanomedicine: recent progress and perspectives.Expert Opin Drug Deliv. 2018 Sep;15(9):881-892. doi: 10.1080/17425247.2018.1517748. Epub 2018 Sep 7. Expert Opin Drug Deliv. 2018. PMID: 30173560 Review.
Cited by
-
Influence of Critical Parameters on Cytotoxicity Induced by Mesoporous Silica Nanoparticles.Nanomaterials (Basel). 2022 Jun 11;12(12):2016. doi: 10.3390/nano12122016. Nanomaterials (Basel). 2022. PMID: 35745355 Free PMC article.
-
Transient Receptor Potential Ion Channel-Dependent Toxicity of Silica Nanoparticles and Poly(amido amine) Dendrimers.J Pharmacol Exp Ther. 2019 Sep;370(3):751-760. doi: 10.1124/jpet.118.253682. Epub 2018 Nov 15. J Pharmacol Exp Ther. 2019. PMID: 30442652 Free PMC article.
-
New "Omics" Approaches as Tools to Explore Mechanistic Nanotoxicology.Adv Exp Med Biol. 2022;1357:179-194. doi: 10.1007/978-3-030-88071-2_8. Adv Exp Med Biol. 2022. PMID: 35583645
-
Biological monitoring of workers exposed to engineered nanomaterials.Toxicol Lett. 2018 Dec 1;298:112-124. doi: 10.1016/j.toxlet.2018.06.003. Epub 2018 Jun 18. Toxicol Lett. 2018. PMID: 29920308 Free PMC article. Review.
-
Silica Nanoparticle-Endothelial Interaction: Uptake and Effect on Platelet Adhesion under Flow Conditions.ACS Appl Bio Mater. 2018 Nov 19;1(5):1620-1627. doi: 10.1021/acsabm.8b00466. Epub 2018 Nov 30. ACS Appl Bio Mater. 2018. PMID: 34046558 Free PMC article.
References
-
- Kim J, Kim HS, Lee N, Kim T, Kim H, Yu T, Song IC, Moon WK, Hyeon T. Multifunctional uniform nanoparticles composed of a magnetite nanocrystal core and a mesoporous silica shell for magnetic resonance and fluorescence imaging and for drug delivery. Angewandte Chemie International Edition. 2008;47(44):8438–8441. - PubMed
-
- Rieter WJ, Kim JS, Taylor KM, An H, Lin W, Tarrant T, Lin W. Hybrid silica nanoparticles for multimodal imaging. Angewandte Chemie International Edition. 2007;46(20):3680–3682. - PubMed
-
- Tapec R, Zhao XJ, Tan W. Development of organic dye-doped silica nanoparticles for bioanalysis and biosensors. Journal of Nanoscience and Nanotechnology. 2002;2(3–4):405–409. - PubMed
-
- Tu HL, Lin YS, Lin HY, Hung Y, Lo LW, Chen YF, Mou CY. In vitro studies of functionalized mesoporous silica nanoparticles for photodynamic therapy. Advanced Materials. 2009;21(2):172–177.
Publication types
MeSH terms
Substances
Grants and funding
LinkOut - more resources
Full Text Sources
Other Literature Sources
Molecular Biology Databases
Miscellaneous

