

Prospective Trial on the Use of Trough Concentration versus Area under the Curve To Determine Therapeutic Vancomycin Dosing
- PMID: 29203493
- PMCID: PMC5786789
- DOI: 10.1128/AAC.02042-17
Prospective Trial on the Use of Trough Concentration versus Area under the Curve To Determine Therapeutic Vancomycin Dosing
Abstract
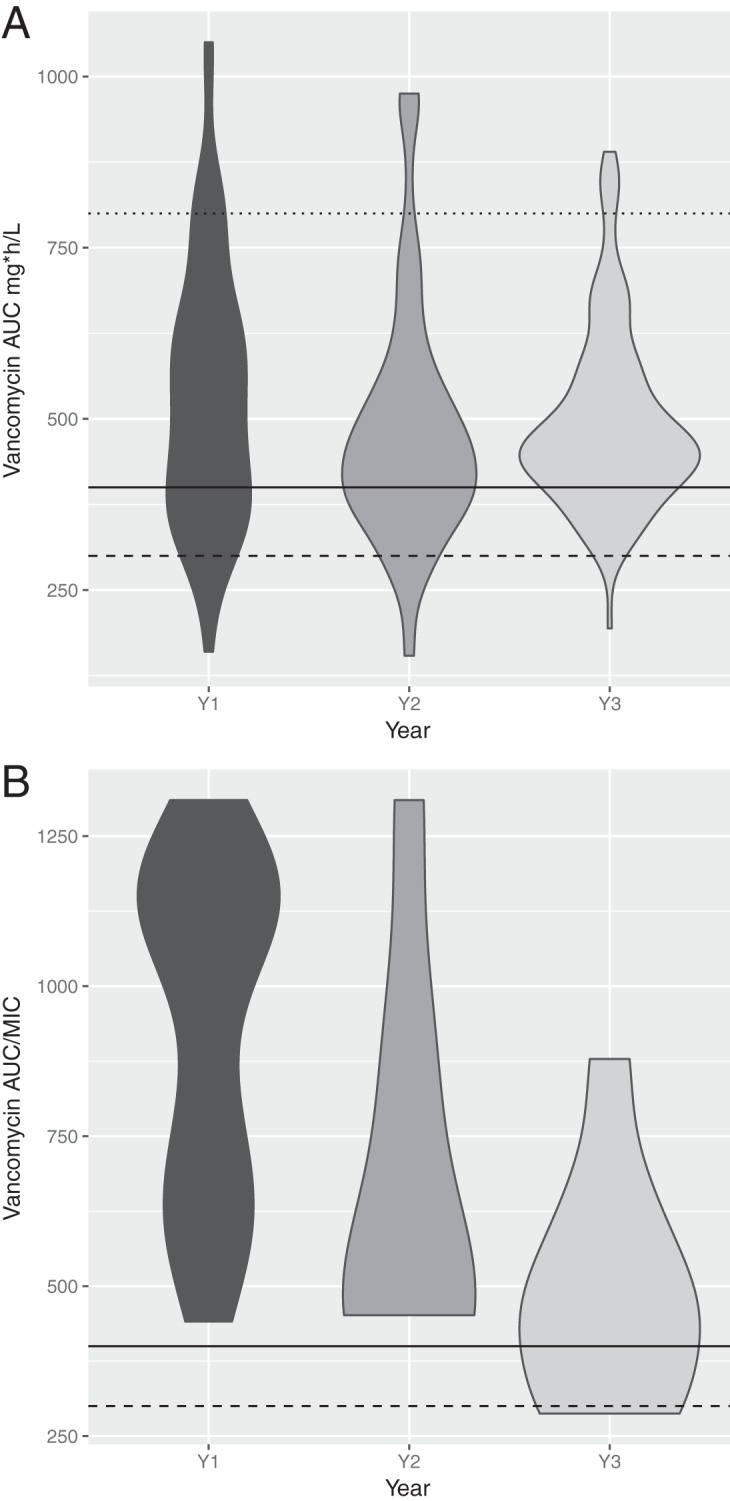
We hypothesized that dosing vancomycin to achieve trough concentrations of >15 mg/liter overdoses many adults compared to area under the concentration-time curve (AUC)-guided dosing. We conducted a 3-year, prospective study of vancomycin dosing, plasma concentrations, and outcomes. In year 1, nonstudy clinicians targeted trough concentrations of 10 to 20 mg/liter (infection dependent) and controlled dosing. In years 2 and 3, the study team controlled vancomycin dosing with BestDose Bayesian software to achieve a daily, steady-state AUC/MIC ratio of ≥400, with a maximum AUC value of 800 mg · h/liter, regardless of trough concentration. For Bayesian estimation of AUCs, we used trough samples in years 1 and 2 and optimally timed samples in year 3. We enrolled 252 adults who were ≥18 years old with ≥1 available vancomycin concentration. Only 19% of all trough concentrations were therapeutic versus 70% of AUCs (P < 0.0001). After enrollment, median trough concentrations by year were 14.4, 9.7, and 10.9 mg/liter (P = 0.005), with 36%, 7%, and 6% over 15 mg/liter (P < 0.0001). Bayesian AUC-guided dosing in years 2 and 3 was associated with fewer additional blood samples per subject (3.6, 2.0, and 2.4; P = 0.003), shorter therapy durations (8.2, 5.4, and 4.7 days; P = 0.03), and reduced nephrotoxicity (8%, 0%, and 2%; P = 0.01). The median inpatient stay was 20 days among nephrotoxic patients versus 6 days (P = 0.002). There was no difference in efficacy by year, with 42% of patients having microbiologically proven infections. Compared to trough concentration targets, AUC-guided, Bayesian estimation-assisted vancomycin dosing was associated with decreased nephrotoxicity, reduced per-patient blood sampling, and shorter length of therapy, without compromising efficacy. These benefits have the potential for substantial cost savings. (This study has been registered at ClinicalTrials.gov under registration no. NCT01932034.).
Keywords: Bayesian; clinical study; prospective; therapeutic drug monitoring; vancomycin.
Copyright © 2018 American Society for Microbiology.
Figures

References
-
- Rybak M, Lomaestro B, Rotschafer JC, Moellering R, Craig W, Billeter M, Dalovisio JR, Levine DP. 2009. Therapeutic monitoring of vancomycin in adult patients: a consensus review of the American Society of Health-System Pharmacists, the Infectious Diseases Society of America, and the Society of Infectious Diseases Pharmacists. Am J Health Syst Pharm 66:82–98. doi:10.2146/ajhp080434. - DOI - PubMed
-
- Larsson AJ, Walker KJ, Raddatz JK, Rotschafer JC. 1996. The concentration-independent effect of monoexponential and biexponential decay in vancomycin concentrations on the killing of Staphylococcus aureus under aerobic and anaerobic conditions. J Antimicrob Chemother 38:589–597. doi:10.1093/jac/38.4.589. - DOI - PubMed
Publication types
MeSH terms
Substances
Associated data
Grants and funding
LinkOut - more resources
Full Text Sources
Other Literature Sources
Medical
