. 2018 Jan 2;215(1):303-318.
doi: 10.1084/jem.20160217. Epub 2017 Dec 4.

High mobility group box 1 orchestrates tissue regeneration via CXCR4

Affiliations

High mobility group box 1 orchestrates tissue regeneration via CXCR4

Mario Tirone et al. J Exp Med. .

Abstract

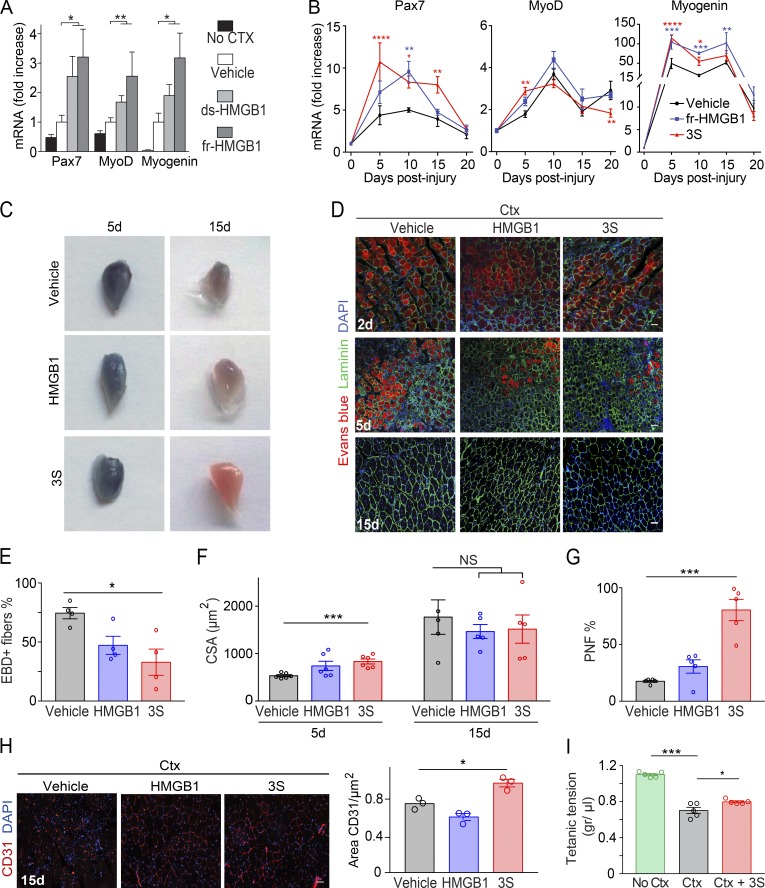
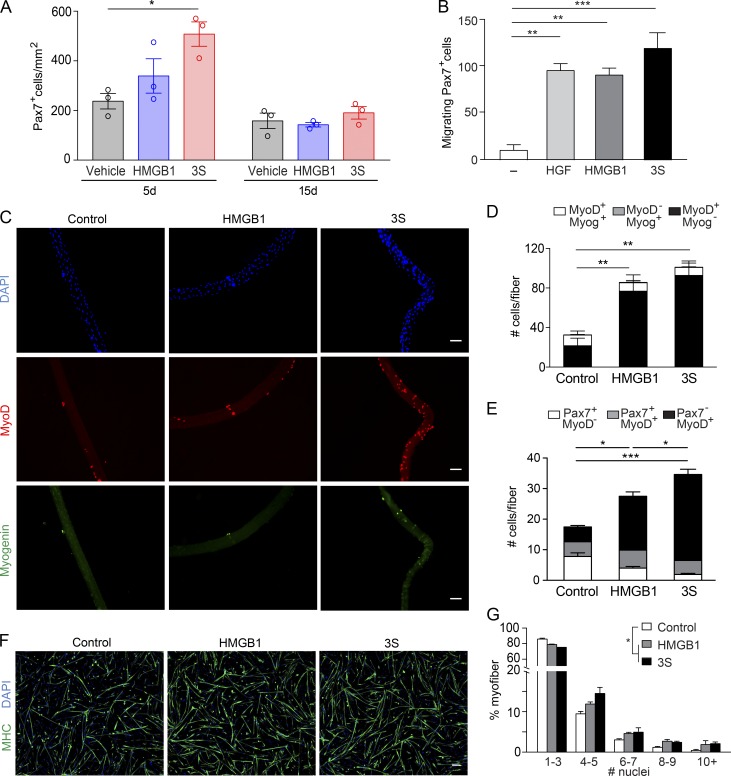
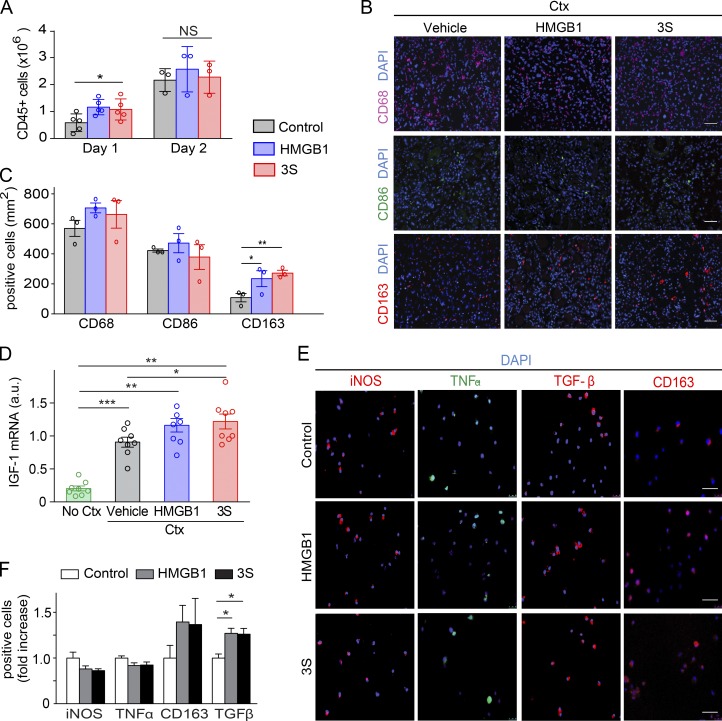
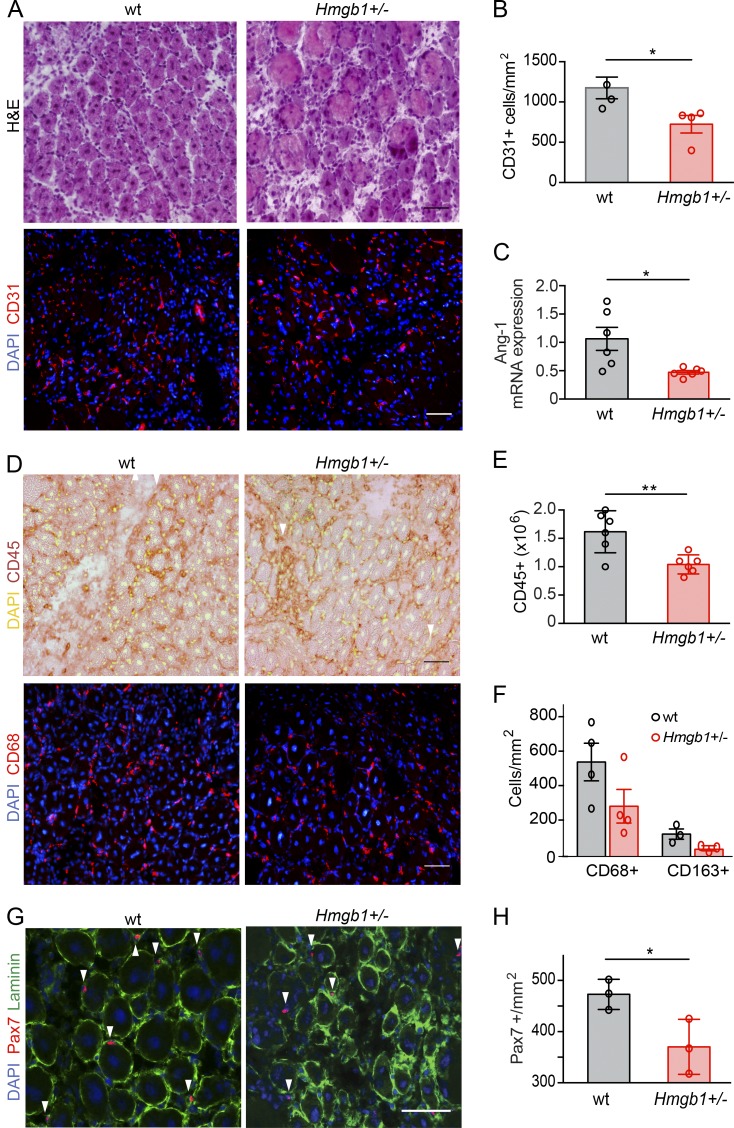
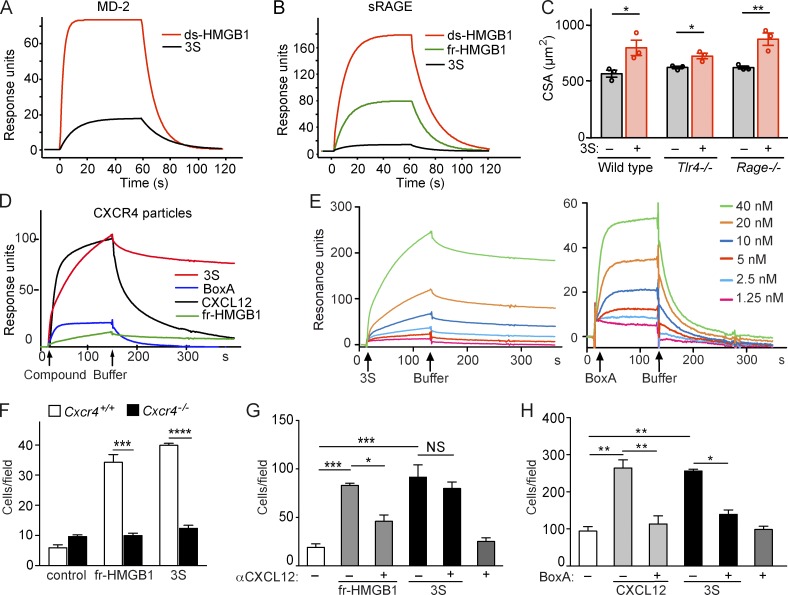
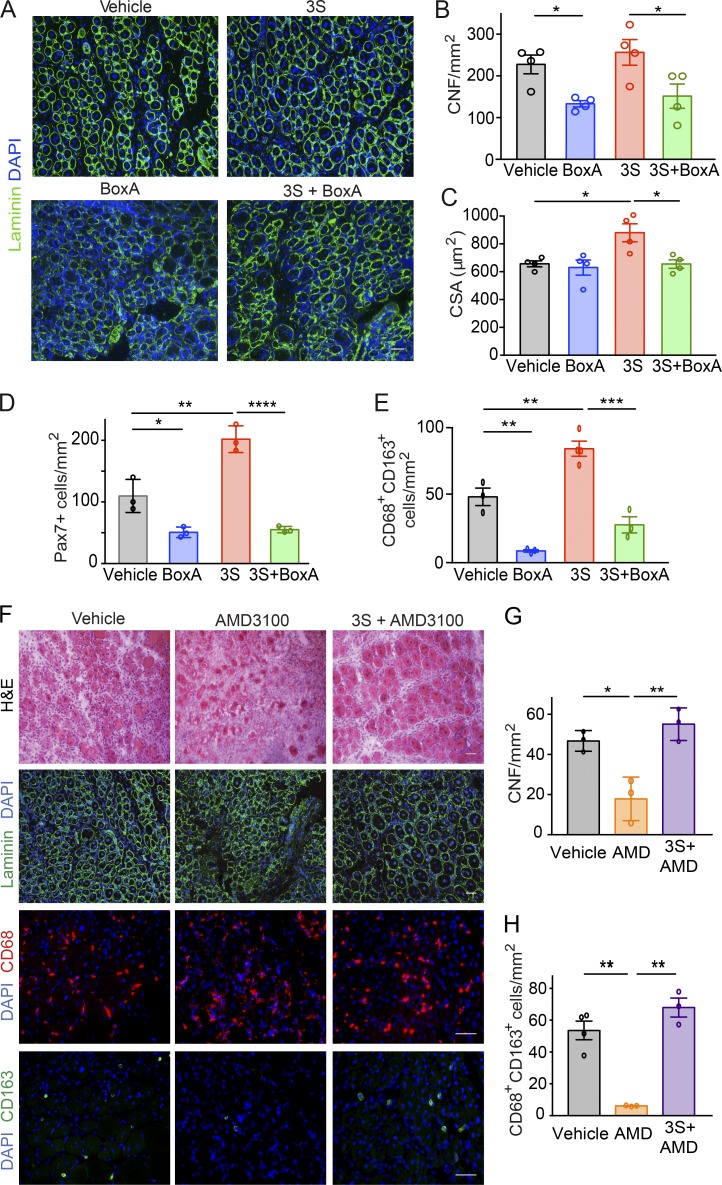
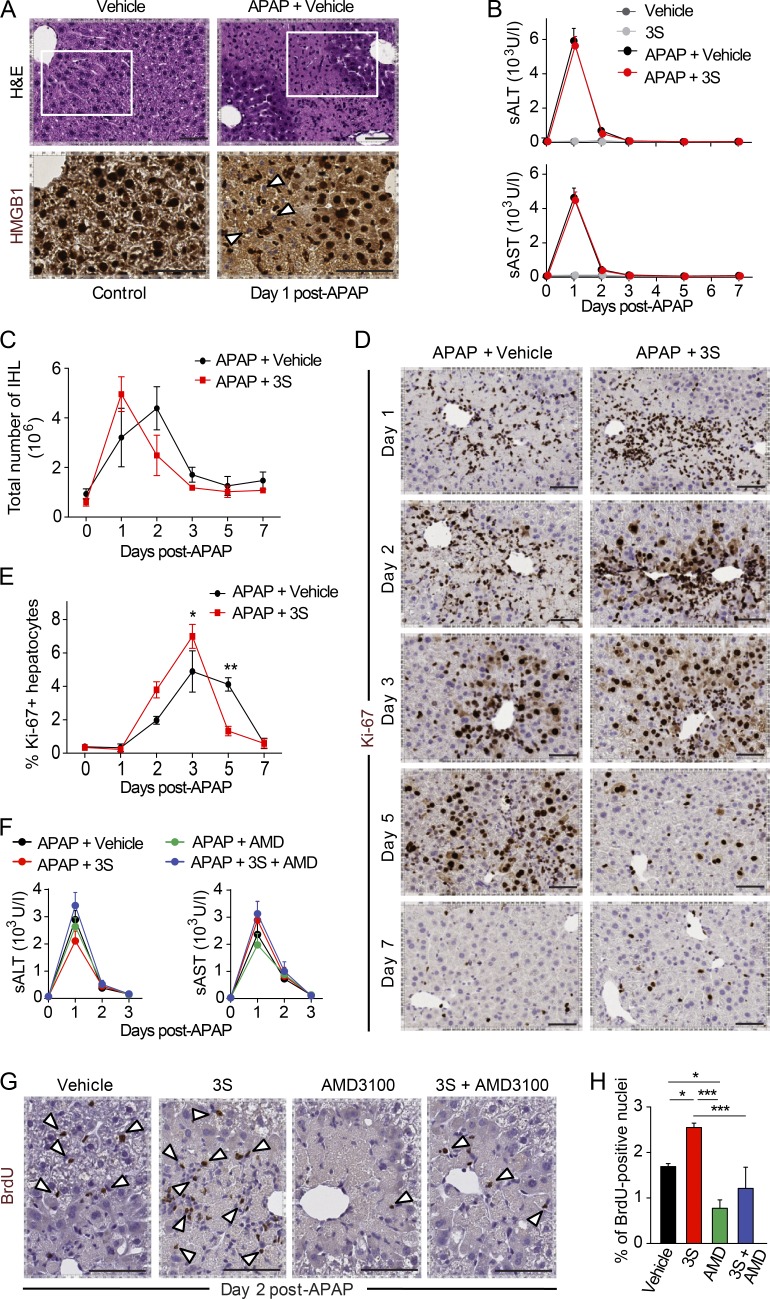
Inflammation and tissue regeneration follow tissue damage, but little is known about how these processes are coordinated. High Mobility Group Box 1 (HMGB1) is a nuclear protein that, when released on injury, triggers inflammation. We previously showed that HMGB1 with reduced cysteines is a chemoattractant, whereas a disulfide bond makes it a proinflammatory cytokine. Here we report that fully reduced HMGB1 orchestrates muscle and liver regeneration via CXCR4, whereas disulfide HMGB1 and its receptors TLR4/MD-2 and RAGE (receptor for advanced glycation end products) are not involved. Injection of HMGB1 accelerates tissue repair by acting on resident muscle stem cells, hepatocytes, and infiltrating cells. The nonoxidizable HMGB1 mutant 3S, in which serines replace cysteines, promotes muscle and liver regeneration more efficiently than the wild-type protein and without exacerbating inflammation by selectively interacting with CXCR4. Overall, our results show that the reduced form of HMGB1 coordinates tissue regeneration and suggest that 3S may be used to safely accelerate healing after injury in diverse clinical contexts.


Figures

Figure 1.
Figure 1.
Intramuscular injection of fr-HMGB1 or 3S accelerates muscle regeneration. (A) Muscle acute injury was induced by injection of Ctx in triceps muscles. Vehicle (PBS) or HMGB1 (fr-HMGB1 or ds-HMGB1) was injected at the same time as Ctx. Quantitative PCR of Pax7, MyoD, and Myogenin (Myog) mRNA in triceps was performed at day 5 after injury (fold increase vs. vehicle). The significance of the difference in gene expression between mice treated with HMGB1 (fr-HMGB1 or ds-HMGB1) and vehicle-treated mice was assessed with Mann-Whitney tests. *, P < 0.05; **, P < 0.01. n = 9 mice per group, three independent experiments. (B–I) Ctx was injected together with vehicle (PBS) or WT fr-HMGB1 (HMGB1) or 3S in TA and/or triceps muscles. Muscle regeneration was assessed at days 2, 5, 10, 15, and 20 after injury. (B) Quantitative PCR of Pax7, MyoD, and Myog mRNA in triceps at days 5, 10, 15, and 20 after injury (fold increase vs. uninjured muscles). n ≥ 5 mice per group, at least two independent experiments. (C) TA muscles, stained with EBD, at days 5 and 15 after injury. (D) EBD, laminin, and DAPI staining of TA muscle sections at days 2, 5, and 15 after injury. Bars, 50 µm. (E) Percentage of EBD-positive myofibers in regenerating TA muscles at day 5 after injury. n = 4 mice per group, two independent experiments. (F) CSA of fibers in TA muscles at days 5 and 15 after injury. n ≥ 5 mice per group, at least two independent experiments. (G) Quantification of myofibers with nuclei at the periphery (PNF) in TA muscles at day 15 after injury. n = 5 mice per group, two independent experiments. (H) CD31 and DAPI staining on TA muscle sections at day 15 after injury and relative quantification of CD31+ area. n = 3 mice per group of three independent experiments. Bars, 50 µm. (I) Tetanic force of TA muscles: uninjured (No Ctx), cardiotoxin-injured (Ctx), Ctx-injured treated with 3S (Ctx + 3S), at day 10 after injury. n = 5 mice per group, two independent experiments. Differences between groups in B and E–I were assessed with one-way ANOVA plus Dunnett’s post-test; data are means ± SEM. *, P < 0.05; **, P < 0.01; ***, P < 0.001; ****, P < 0.0001.
Figure 2.
Figure 2.
fr-HMGB1/3S promotes skeletal muscle regeneration by acting on satellite cells. (A) TA muscle acute injury was induced by injection of Ctx; vehicle (PBS) or WT fr-HMGB1 (HMGB1) or 3S was injected together with Ctx. Pax7+ cells were quantified in regenerating TA muscles at days 5 and 15 after injury. n = 3 mice per group, two independent experiments. (B) Ex vivo migration of primary mouse Pax7+ cells toward 40 nM HMGB1 (fully reduced) or 3S. Hepatocyte growth factor (HGF) was used as the positive control. n = 3 independent experiments. (C–E) Single myofibers isolated from mouse muscles were cultured in proliferation medium for 72 (C and D) or 16 h (E) with or without 40 nM fr-HMGB1 or 3S. Relative numbers of MyoD+ and/or Myogenin+ cells at 72 h (D) and of Pax7+ and/or MyoD+ cells at 16 h (E) on single fibers. n = 3 mice, 10 fibers/mouse, three independent experiments. Bars, 50 µm. (F and G) Representative images of mouse primary myoblasts cultured for 48 h in differentiating medium, with or without 40 nM fr-HMGB1 or 3S, and stained with DAPI and anti–myosin heavy chain (MHC) antibody (F), and distribution of myofiber size (G). Bar, 100 µm. The differences between control and treatments are statistically significant (P < 0.0001, χ2 test). Data are representative of two independent experiments with biological triplicates. Data are means ± SEM. Statistical significance was assessed with one-way ANOVA plus Dunnett’s post-test in A, B, D, and E. *, P < 0.05; **, P < 0.01; ***, P < 0.001.
Figure 3.
Figure 3.
fr-HMGB1/3S modulates macrophage polarization toward a tissue-healing phenotype. (A–D) TA muscles were injected with Ctx alone or Ctx plus WT fr-HMGB1 (HMGB1) or 3S. (A) Quantification of CD45+ cells isolated from injured muscles at days 1 (n = 5 mice per group of three independent experiments) and 2 (n = 3 mice per group of three independent experiments) after injury. (B and C) Representative immunofluorescence staining for CD68, CD86, and CD163 on sections of TA muscles at day 5 after injury (B) and quantification of CD68+ (n = 3 mice per group), CD68+CD86+, and CD68+CD163+ cells (n = 5 mice per group) in sections of TA muscles (C), two independent experiments. Bars, 50 µm. (D) Quantitative PCR of IGF-1 mRNA in triceps at day 5 after injury. n = 9 mice per group of three independent experiments. (E and F) Mouse bone marrow–derived macrophages were cultured for 7 d in DMEM conditioned by L929 cells (enriched in CSF-1) and polarized for 3 d toward a proinflammatory phenotype by stimulation with IFNγ (50 ng/ml) with or without 40 nM fr-HMGB1 or 3S. Representative images of macrophages (E) and quantification of cells positive for iNOS, TNFα, TGFβ, and CD163 expression, analyzed by immunofluorescence staining (F; fold increase vs. control; at least three independent experiments). Bars, 50 µm. Data are means ± SEM. Statistical significance was assessed with one-way ANOVA plus Dunnett’s post-test in A, C, D, and F. *, P < 0.05; **, P < 0.01; ***, P < 0.001.
Figure 4.
Figure 4.
High expression of HMGB1 is required for optimal skeletal muscle regeneration. Muscle acute injury was induced by injection of Ctx in TA and/or triceps muscles of WT or Hmgb1+/− mice, and regeneration was assessed at day 5 after injury. (A) H&E and immunofluorescence staining (DAPI and CD31) of TA muscle sections from WT and Hmgb1+/− mice at day 5 after injury. Bars, 50 µm. (B) Quantification of CD31-positive cells/mm2 in TA muscles of WT and Hmgb1+/− mice at day 5 after injury. n = 4 mice per group of three independent experiments. (C) Quantitative PCR analysis of mRNA levels of angiopoietin-1 (Ang-1) in triceps at day 5 after injury. n = 6 mice per group of two independent experiments. (D) Representative immunostaining (DAPI and CD45, top; DAPI and CD68, bottom) of TA muscle sections from WT and Hmgb1+/− mice at day 5 after injury. Bars, 50 µm. (E) Quantification of CD45-positive cells isolated with immunobeads from injured muscles. n = 6 mice per group of two independent experiments. (F) Quantification of CD68-positive cells (n = 4 mice) and CD68/CD163-positive macrophages (n = 3 mice) in TA muscle sections from WT and Hmgb1+/− mice at day 5 after injury, two independent experiments. (G) Representative immunofluorescence staining for DAPI, laminin, and Pax7 in TA muscles from WT and Hmgb1+/− mice at day 5 after injury (Pax7-positive cells indicated with white arrowheads). Bars, 50 µm. (H) Quantification of Pax7-positive cells in TA muscles of WT and Hmgb1+/− mice at day 5 after injury. n = 3 mice per group of two independent experiments. In all panels, data are means ± SEM, and statistical significance was assessed with Student’s t test. *, P < 0.05; **, P < 0.01.
Figure 5.
Figure 5.
3S and BoxA directly bind to CXCR4. (A and B) SPR sensorgrams representing the binding of HMGB1 isoforms to immobilized MD-2 (A) or sRAGE (B). ds-HMGB1 and 3S bind to MD-2 with an apparent KD of 0.35 µM and 2 µM, respectively (A). Binding to sRAGE: apparent KD of 1 µM for ds-HMGB1 and 3.5 µM for fr-HMGB1 and 3S (B). Data are representative of three independent experiments. (C) TA muscles of WT, Tlr4−/− and Rage−/− mice were injected with Ctx and vehicle (PBS) or 3S, and the CSA of centronucleated fibers was measured at day 5 after injury. n = 3 mice per group, two independent experiments. Data are means ± SEM. Student t tests within each genotype: *, P < 0.05; **, P < 0.01. (D) Sensorgrams representing the binding of 40 nM fr-HMGB1 or 3S, 50 nM CXCL12, and 40 nM BoxA to immobilized lentiviral particles with membrane-bound CXCR4. (E) Sensorgrams representing the binding of different concentrations of 3S (left) or BoxA (right) to immobilized lentiviral particles with membrane-bound CXCR4. Curves derived from these assays were analyzed by fitting to a simple one-site interaction model with BIA Evaluation 4.1 software (GE Healthcare). Data are representative of three independent experiments. (F) Migration of WT (Cxcr4+/+) or Cxcr4−/− MEFs toward 0.4 nM fr-HMGB1 or 3S. Data are representative of three independent experiments and are means ± SEM. Statistical significance between genotypes was calculated with Student’s t test. ***, P < 0.001; ****, P < 0.0001. (G and H) Migration of myoblasts toward 40 nM fr-HMGB1 and 3S with or without 10 nM anti-CXCL12 antibody (G) or toward 40 nM 3S and 30 nM CXCL12 with or without 250 nM BoxA (H). Data are means ± SEM of triplicates, two independent experiments. Differences between treatments were assessed with one-way ANOVA plus Tukey’s post-test. *, P < 0.05; **, P < 0.01, ***, P < 0.001.
Figure 6.
Figure 6.
HMGB1 supports muscle regeneration via CXCR4. (A–E) Comparison of C57BL/6 mice treated with Ctx plus vehicle versus Ctx plus BoxA and Ctx plus 5 mg/kg 3S with or without 10 mg/kg BoxA. (A) Laminin and DAPI staining of TA muscle sections at day 5 after injury. Bar, 50 µm. Number (B) and CSA of centronucleated fibers (CNFs; C) in TA muscles at day 5 after injury. n = 4 mice per group, two independent experiments. (D) Quantification of Pax7+ cells in regenerating TA muscles at day 5 after injury. n = 3 mice per group, two independent experiments. (E) Quantification of CD68+CD163+ cells in sections of TA muscles at day 5 after injury. n = 4 mice per group, two independent experiments. (F–H) Comparison of muscles from mice receiving one single intramuscular injection of Ctx plus vehicle (PBS) versus Ctx plus 5 mg/kg AMD3100 with or without 5 mg/kg 3S. (F) Representative images of H&E and immunofluorescence staining for DAPI and laminin or CD68/CD163. Bars, 50 µm. (G) Number of CNFs in TA muscles at day 5 after injury. n = 3 mice per group, two independent experiments. (H) Quantification of CD68+CD163+ cells on sections of TA muscles at day 5 after injury. n = 3 mice per group, two independent experiments. Differences between groups were assessed with one-way ANOVA plus Tukey’s post-test. *, P < 0.05; **, P < 0.01; ***, P < 0.001; ****, P < 0.0001.
Figure 7.
Figure 7.
3S accelerates liver regeneration via CXCR4. DILI was induced by i.p. injection of 300 mg/kg (body weight) APAP. 2 h later, mice received one single i.p. injection of vehicle (NaCl), 500 µg/mouse 3S, or 200 µg/mouse AMD3100 with or without 500 µg/mouse 3S. Serum collection and necroscopy were performed at different time points, and hepatic regeneration was assessed by i.p. injection of 1 mg/mouse BrdU 16 h before liver collection. (A) Representative images of H&E staining and HMGB1 immunostaining of liver in control mice on day 1 after DILI. HMGB1 negative nuclei (white arrowheads) are visible at higher magnification of the areas identified by rectangles in APAP-treated mice. Bars, 50 µm. (B) sALT and sAST in serum after APAP injection in mice treated with vehicle or 3S. n = 6 mice per group, two independent experiments. (C) Quantification of intrahepatic leukocytes (IHL) at days 1, 2, 3, 5, and 7 after APAP injection in control mice and after DILI in mice treated with vehicle or 3S. n = 4 mice per group, two independent experiments. Data are means ± SEM, and differences between groups were assessed with two-way ANOVA plus Bonferroni post-tests. The interaction between treatment and time is not significant. (D and E) Representative images of Ki-67 immunostaining (D) and quantification of Ki-67–positive hepatocytes (E) in livers from mice treated with vehicle or 3S at days 1, 2, 3, 5, and 7 after APAP injection. Bars, 50 µm. n = 4 mice per group, two independent experiments. Data are means ± SEM, and differences between groups were assessed with two-way ANOVA plus Bonferroni post-tests. The interaction between treatment and time is significant (P = 0.0003). (F) sALT and sAST after APAP injection in mice treated with vehicle, 3S, or AMD3100 with or without 3S. n = 4 mice per group, two independent experiments. Differences between groups in B and F were assessed with one-way ANOVA plus Dunnett’s post-test. (G and H) Representative images of BrdU immunostaining (G; BrdU-positive hepatocytes indicated with white arrowheads) and quantification of BrdU-positive hepatocytes (H) in livers from mice treated with vehicle, 3S, or AMD3100 with or without 3S at day 2 after APAP injection. Bars, 50 µm. n = 4 mice per group. Data are means ± SEM, and differences between groups were assessed with one-way ANOVA plus Bonferroni post-tests. *, P < 0.05; **, P < 0.01; ***, P < 0.001.

References

    1. Agalave N.M., Larsson M., Abdelmoaty S., Su J., Baharpoor A., Lundbäck P., Palmblad K., Andersson U., Harris H., and Svensson C.I.. 2014. Spinal HMGB1 induces TLR4-mediated long-lasting hypersensitivity and glial activation and regulates pain-like behavior in experimental arthritis. Pain. 155:1802–1813. 10.1016/j.pain.2014.06.007 - DOI - PubMed
    1. Antoine D.J., Jenkins R.E., Dear J.W., Williams D.P., McGill M.R., Sharpe M.R., Craig D.G., Simpson K.J., Jaeschke H., and Park B.K.. 2012. Molecular forms of HMGB1 and keratin-18 as mechanistic biomarkers for mode of cell death and prognosis during clinical acetaminophen hepatotoxicity. J. Hepatol. 56:1070–1079. 10.1016/j.jhep.2011.12.019 - DOI - PMC - PubMed
    1. Arnold L., Henry A., Poron F., Baba-Amer Y., van Rooijen N., Plonquet A., Gherardi R.K., and Chazaud B.. 2007. Inflammatory monocytes recruited after skeletal muscle injury switch into antiinflammatory macrophages to support myogenesis. J. Exp. Med. 204:1057–1069. 10.1084/jem.20070075 - DOI - PMC - PubMed
    1. Balosso S., Liu J., Bianchi M.E., and Vezzani A.. 2014. Disulfide-containing high mobility group box-1 promotes N-methyl-D-aspartate receptor function and excitotoxicity by activating Toll-like receptor 4-dependent signaling in hippocampal neurons. Antioxid. Redox Signal. 21:1726–1740. 10.1089/ars.2013.5349 - DOI - PubMed
    1. Bischoff R. 1997. Chemotaxis of skeletal muscle satellite cells. Dev. Dyn. 208:505–515. 10.1002/(SICI)1097-0177(199704)208:4<505::AID-AJA6>3.0.CO;2-M - DOI - PubMed

Publication types