

3D genome of multiple myeloma reveals spatial genome disorganization associated with copy number variations
- PMID: 29203764
- PMCID: PMC5715138
- DOI: 10.1038/s41467-017-01793-w
3D genome of multiple myeloma reveals spatial genome disorganization associated with copy number variations
Abstract
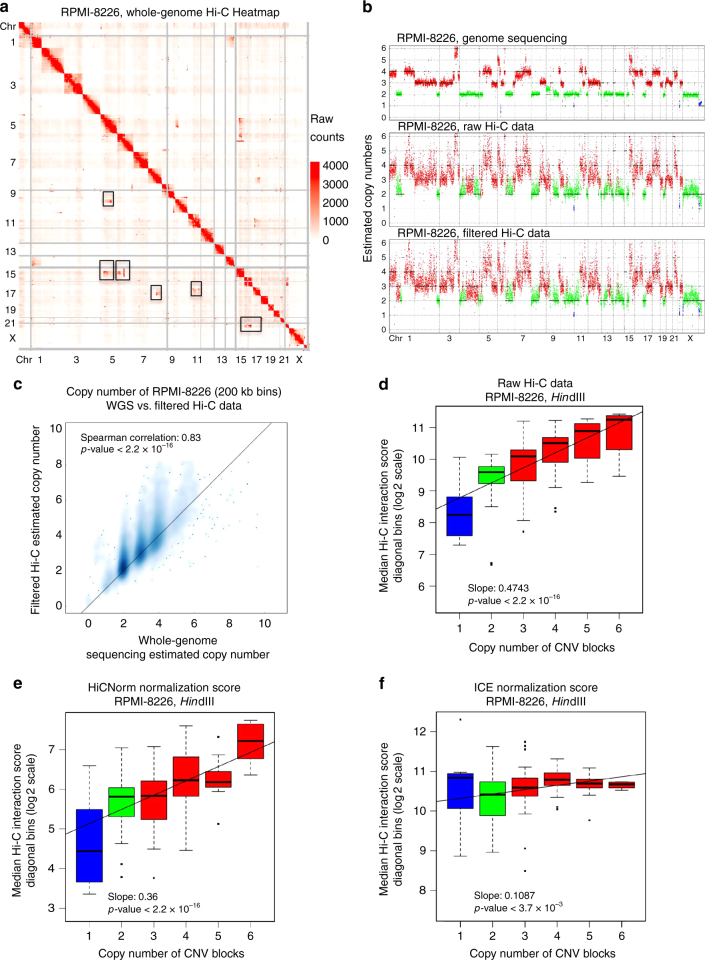
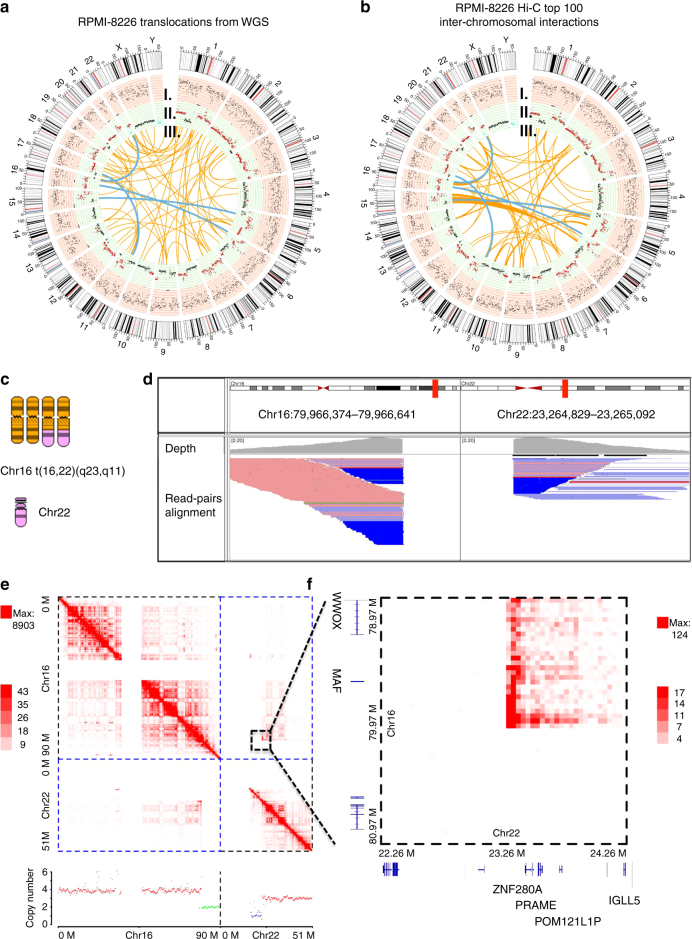
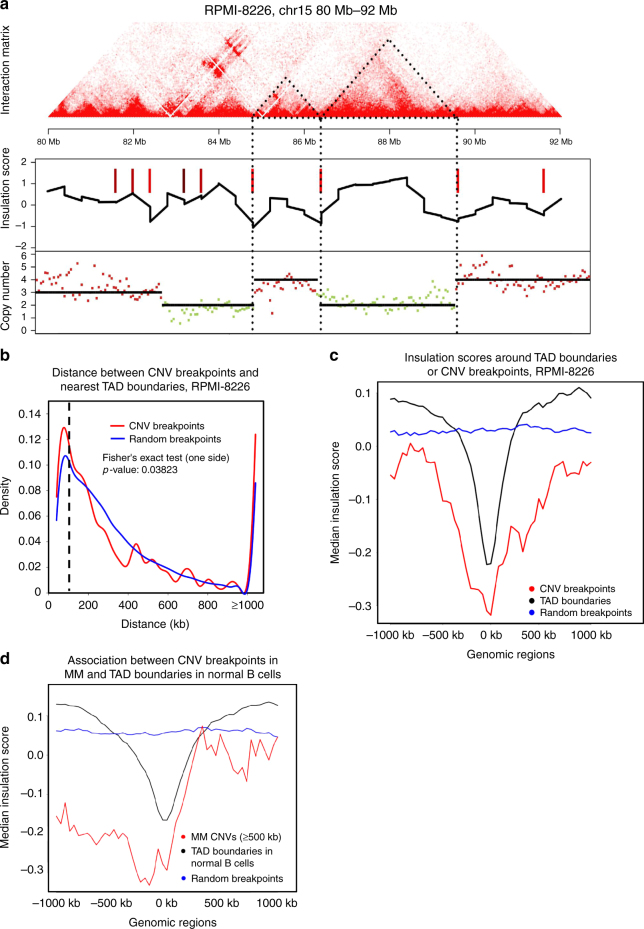
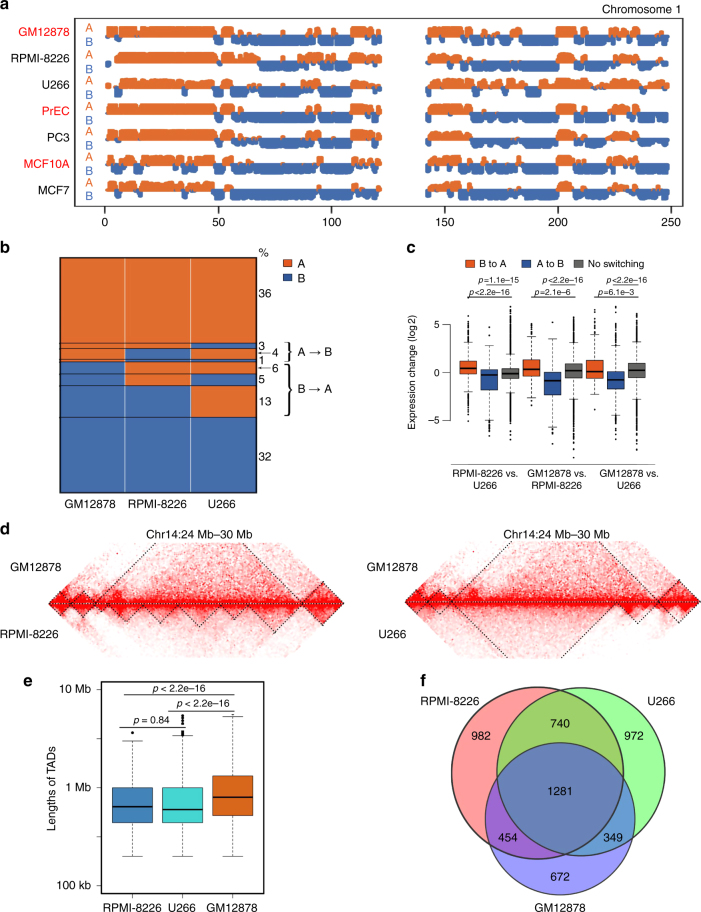
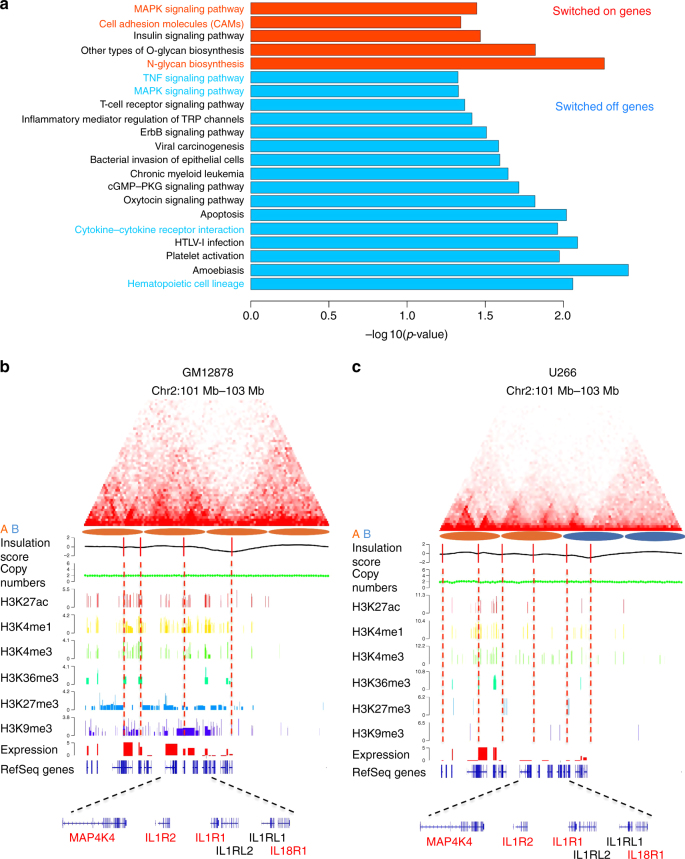
The Hi-C method is widely used to study the functional roles of the three-dimensional (3D) architecture of genomes. Here, we integrate Hi-C, whole-genome sequencing (WGS) and RNA-seq to study the 3D genome architecture of multiple myeloma (MM) and how it associates with genomic variation and gene expression. Our results show that Hi-C interaction matrices are biased by copy number variations (CNVs) and can be used to detect CNVs. Also, combining Hi-C and WGS data can improve the detection of translocations. We find that CNV breakpoints significantly overlap with topologically associating domain (TAD) boundaries. Compared to normal B cells, the numbers of TADs increases by 25% in MM, the average size of TADs is smaller, and about 20% of genomic regions switch their chromatin A/B compartment types. In summary, we report a 3D genome interaction map of aneuploid MM cells and reveal the relationship among CNVs, translocations, 3D genome reorganization, and gene expression regulation.
Conflict of interest statement
The authors declare no competing financial interests.
Figures
Similar articles
-
Three-dimensional genome landscape comprehensively reveals patterns of spatial gene regulation in papillary and anaplastic thyroid cancers: a study using representative cell lines for each cancer type.Cell Mol Biol Lett. 2023 Jan 6;28(1):1. doi: 10.1186/s11658-022-00409-6. Cell Mol Biol Lett. 2023. PMID: 36609218 Free PMC article.
-
3D disorganization and rearrangement of genome provide insights into pathogenesis of NAFLD by integrated Hi-C, Nanopore, and RNA sequencing.Acta Pharm Sin B. 2021 Oct;11(10):3150-3164. doi: 10.1016/j.apsb.2021.03.022. Epub 2021 Apr 6. Acta Pharm Sin B. 2021. PMID: 34729306 Free PMC article.
-
Identification and utilization of copy number information for correcting Hi-C contact map of cancer cell lines.BMC Bioinformatics. 2020 Nov 7;21(1):506. doi: 10.1186/s12859-020-03832-8. BMC Bioinformatics. 2020. PMID: 33160308 Free PMC article.
-
Alterations in Three-Dimensional Organization of the Cancer Genome and Epigenome.Cold Spring Harb Symp Quant Biol. 2016;81:41-51. doi: 10.1101/sqb.2016.81.031013. Epub 2017 Apr 19. Cold Spring Harb Symp Quant Biol. 2016. PMID: 28424341 Review.
-
Two main stream methods analysis and visual 3D genome architecture.Semin Cell Dev Biol. 2019 Jun;90:43-53. doi: 10.1016/j.semcdb.2018.07.011. Epub 2018 Aug 16. Semin Cell Dev Biol. 2019. PMID: 30059749 Review.
Cited by
-
Effects of Differentially Methylated CpG Sites in Enhancer and Promoter Regions on the Chromatin Structures of Target LncRNAs in Breast Cancer.Int J Mol Sci. 2024 Oct 15;25(20):11048. doi: 10.3390/ijms252011048. Int J Mol Sci. 2024. PMID: 39456830 Free PMC article.
-
Mixed secondary chromatin structure revealed by modeling radiation-induced DNA fragment length distribution.Sci China Life Sci. 2020 Jun;63(6):825-834. doi: 10.1007/s11427-019-1638-6. Epub 2020 Apr 2. Sci China Life Sci. 2020. PMID: 32279284
-
Highly connected 3D chromatin networks established by an oncogenic fusion protein shape tumor cell identity.Sci Adv. 2023 Mar 31;9(13):eabo3789. doi: 10.1126/sciadv.abo3789. Epub 2023 Mar 31. Sci Adv. 2023. PMID: 37000878 Free PMC article.
-
HiSV: A control-free method for structural variation detection from Hi-C data.PLoS Comput Biol. 2023 Jan 6;19(1):e1010760. doi: 10.1371/journal.pcbi.1010760. eCollection 2023 Jan. PLoS Comput Biol. 2023. PMID: 36608109 Free PMC article.
-
The 3D genome of plasma cells in multiple myeloma.Sci Rep. 2025 Jun 2;15(1):19331. doi: 10.1038/s41598-025-03132-2. Sci Rep. 2025. PMID: 40456819 Free PMC article.
References
Publication types
MeSH terms
Substances
LinkOut - more resources
Full Text Sources
Other Literature Sources
Medical
Molecular Biology Databases
