. 2017 Dec 4;8(1):1915.
doi: 10.1038/s41467-017-02057-3.

Internalization of a polysialic acid-binding Escherichia coli bacteriophage into eukaryotic neuroblastoma cells

Affiliations

Internalization of a polysialic acid-binding Escherichia coli bacteriophage into eukaryotic neuroblastoma cells

Timo A Lehti et al. Nat Commun. .

Abstract

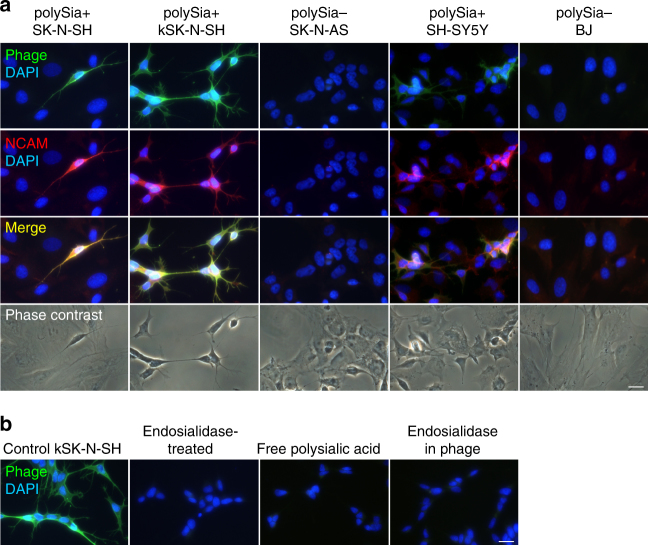
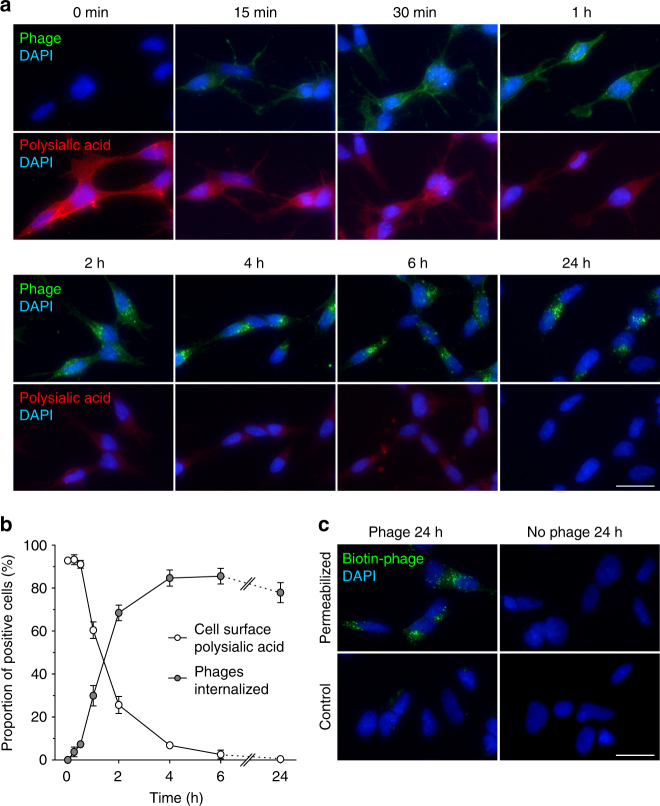
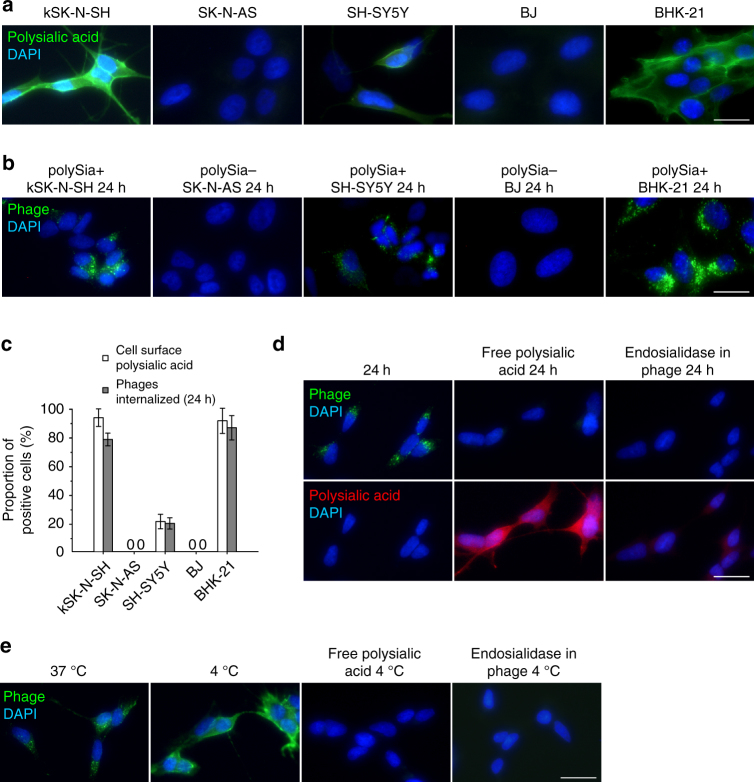
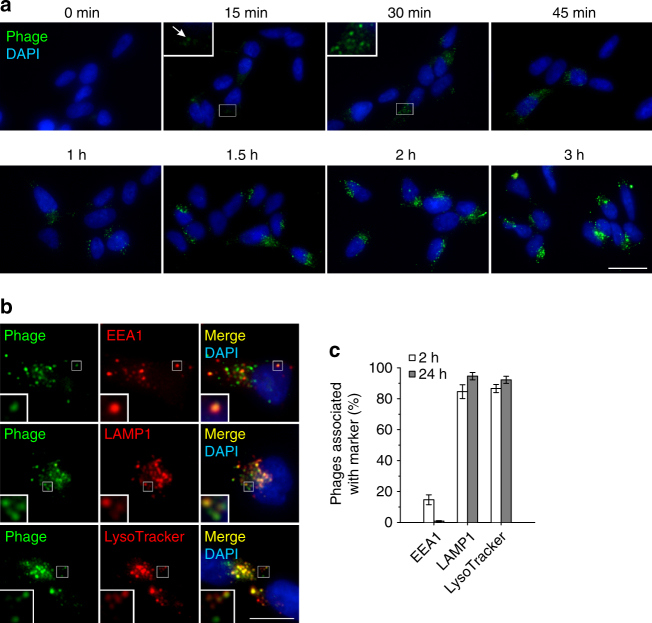
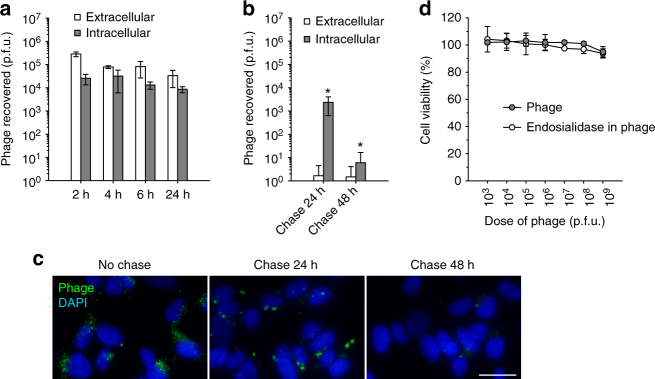
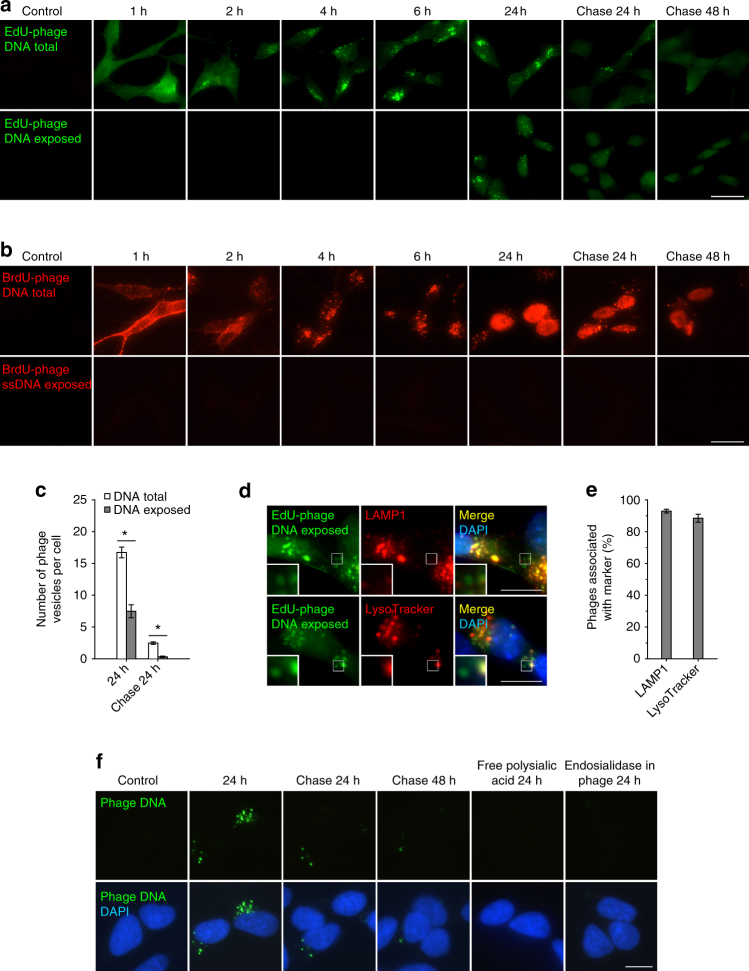
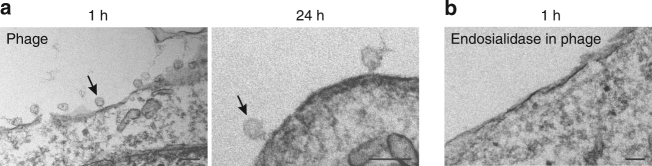
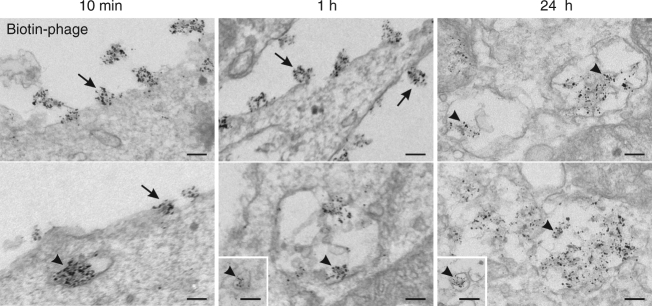
Eukaryotic organisms are continuously exposed to bacteriophages, which are efficient gene transfer agents in bacteria. However, bacteriophages are considered not to pass the eukaryotic cell membrane and enter nonphagocytic cells. Here we report the binding and penetration of Escherichia coli PK1A2 bacteriophage into live eukaryotic neuroblastoma cells in vitro. The phage interacts with cell surface polysialic acid, which shares structural similarity with the bacterial phage receptor. Using fluorescence and electron microscopy, we show that phages are internalized via the endolysosomal route and persist inside the human cells up to one day without affecting cell viability. Phage capsid integrity is lost in lysosomes, and the phage DNA is eventually degraded. We did not detect the entry of phage DNA into the nucleus; however, we speculate that this might occur as a rare event, and propose that this potential mechanism could explain prokaryote-eukaryote gene flow.


Conflict of interest statement

The authors declare no competing financial interests.

Figures

Fig. 1
Fig. 1
Bacteriophage PK1A2 binds specifically to mammalian polysialic acid-expressing cells. a Fluorescence microscopic images of cells incubated with FITC-labeled PK1A2 phages (green) and neural cell adhesion molecule NCAM antibodies (red) to assess phage surface binding. Polysialic acid-containing (polySia+) human neuroblastoma SK-N-SH, kSK-N-SH and SH-SY5Y cells as well as human polysialic acid-negative (polySia−) neuroblastoma SK-N-AS and fibroblast BJ cells were incubated with FITC-labeled phages for 1 h at room temperature and stained for NCAM, the carrier protein of polysialic acid. b Inhibition of phage binding to kSK-N-SH cells by pretreatment with endosialidase or incubation in the presence of free polysialic acid. As a control, phage containing catalytically active endosialidase as the binding agent was used. Nuclei were stained with DAPI (blue). Representative images from two to three biological replicates are shown. The scale bars represent 20 µm
Fig. 2
Fig. 2
Phages are endocytosed into live neuroblastoma cells. a Time course of PK1A2 phage internalization into cultured kSK-N-SH cells. Cells were incubated with FITC-labeled phages (green) at 37 °C for the times indicated, fixed and examined for the presence of phages and surface-expressed polysialic acid (red). b Quantitative analysis of phage internalization. Data are presented as the percentages of positive cells that stained for cell surface polysialic acid or contained internalized phages and the values represent means of three randomly chosen fields ± s.d. of a single experiment. For each field, at least 60 cells were examined. c Immunofluorescence detection of internalized biotin-conjugated phages after 24 h of incubation. Control cells or cells permeabilized with 0.2% Triton X-100 were stained with Alexa Fluor 488 FluoroNanogold-streptavidin (green). Cells without phages were used as control of staining specificity. Nuclei were stained with DAPI (blue). All data shown are representative for two biological replicates. The scale bars represent 20 µm
Fig. 3
Fig. 3
Phage internalization requires polysialic acid. a Detection of cell surface polysialic acid in human neuroblastoma (kSK-N-SH, SK-N-AS and SH-SY5Y), human fibroblast (BJ) and hamster kidney (BHK-21) cells. The cells were grown on coverslips, fixed and stained for surface-expressed polysialic acid. b Internalization of FITC-labeled PK1A2 phages into polysialic acid-containing (polySia+ ) cells compared to polysialic acid-negative (polySia−) cells after 24 h of incubation at 37 °C. c Quantitative analysis of phage internalization. Percentages of cells expressing cell surface polysialic acid or having endocytosed FITC-labeled phages after incubation with phages for 24 h at 37 °C. The values represent means of three randomly chosen fields ± s.d. of a single experiment. For each field, at least 25 cells were examined. d Inhibition of phage internalization. kSK-N-SH cells incubated with phages (green) in the absence or the presence of free polysialic acid, or control phages containing active endosialidase for 24 h at 37 °C. After incubation, the cells were fixed and stained for surface-expressed polysialic acid (red). e Effect of low temperature on phage internalization. kSK-N-SH cells were incubated with phages in the absence or the presence of free polysialic acid for 4 h at 37 or 4 °C, or control phages containing active endosialidase for 4 h at 4 °C. Nuclei were stained with DAPI (blue). All data shown are representative for two biological replicates. The scale bars represent 20 µm
Fig. 4
Fig. 4
Progression of phage internalization after removal of surface-bound phages and direction to lysosomes. a Time course of PK1A2 phage internalization into kSK-N-SH cells. Following incubation with FITC-labeled phages (green) for the times indicated at 37 °C, the non-internalized phages were stripped off by polysialic acid competition. An intracellular phage cluster is indicated with an arrow. b Phage clusters in early-endosomal and lysosomal compartments. kSK-N-SH cells were incubated with FITC-labeled phages (green) for 2 h at 37 °C, extracellular phages were removed by polysialic acid competition, and the fixed cells were immunostained for the early-endosomal marker EEA1 or late endosomal/lysosomal marker LAMP1 (red). The lysosomal stain LysoTracker (red) was added to the medium 30 min before the end of incubation with phage. c Quantification of phage clusters positive for EEA1, LAMP1 or LysoTracker. Following incubation with FITC-labeled phages for 2 or 24 h at 37 °C, the cells were subjected to immunostaining as in b. The data represent the mean ± s.d. of two independent experiments depicting the results from at least 300 vesicles for each condition. In all experiments nuclei were stained with DAPI (blue). Representative images from two to four biological replicates are shown. The scale bars represent 20 µm in a, 10 µm in b, the insets have been enlarged 3-fold
Fig. 5
Fig. 5
Persistence and inactivation of internalized phage. a Recovery of internalized or cell surface bound PK1A2 phages from kSK-N-SH cells. Cells were incubated with phages at 37 °C for the times indicated. The amounts of extracellular and intracellular phages were determined and are shown as plaque-forming units (p.f.u.). Each bar represents the mean ± s.d. of three independent experiments. b Inactivation of internalized phages in the cells. Cells were pulsed with phages for 24 h at 37 °C, after which extracellular phages were removed by polysialic acid competition (last column in a). Subsequently, the phages were chased with cell medium without phages for the times indicated. Phage quantitation results are expressed as mean ± s.d. of three independent experiments. The asterisks mark P-value of < 0.03 (compared to last column in a) as calculated by Student’s t-test. c Visualization of phages in pulse-chase experiment. Cells were pulsed with FITC-labeled phages (green) and chased with phage-free cell medium as in a and b, respectively. Nuclei were stained with DAPI (blue). Representative images from two biological replicates are shown. The scale bar represents 20 µm. d Absence of cellular cytotoxicity of phage. kSK-N-SH cells were incubated with increasing doses of phage or endosialidase-containing control phage in the growth medium for 24 h and subjected to cell viability assay. The data represent the mean ± s.d. of three independent experiments including two technical replicates each
Fig. 6
Fig. 6
Time course of the exposure of phage DNA inside the cell. a, b Internalization of DNA-labeled PK1A2 phages into cultured kSK-N-SH cells at 37 °C. EdU (a) or BrdU (b) labeled phages (green and red, respectively) were detected under the conditions showing total DNA or exposed DNA as described in Methods. EdU staining reveals DNA irrespective of strand form, the BrdU method reveals DNA in single-strand form. Representative images from three biological replicates are shown. c Quantification of phage vesicles positive for EdU at 24 h and after subsequent chase for 24 h (each vesicle may contain several phage particles). At least 100 cells were quantified for each condition. Results are expressed as mean ± s.d. of three independent experiments. The asterisks mark P-value of < 0.005 as calculated by Student’s t-test. d Association of EdU-labeled phage clusters with lysosomal compartments. The cells were incubated with phages (green) for 24 h at 37 °C to reveal exposed phage DNA and LAMP1 (red) or LysoTracker (red) as in Figs. 4b and 6a. Nuclei were stained with DAPI (blue). Representative images from two biological replicates are shown. e Quantification of EdU-labeled phage vesicles positive for LAMP1 or LysoTracker at 24 h in d. At least 300 vesicles were analyzed for each condition and the data represent the mean ± s.d. of two independent experiments. f Detection of internalized phage DNA by fluorescence in situ hybridization (FISH). kSK-N-SH cells were incubated with phages in the absence or the presence of free polysialic acid or with control phages containing active endosialidase at 37 °C for the times indicated. The samples were processed for in situ hybridization using Alexa Fluor 488-labeled DNA probes covering the phage genome (green). Nuclei were stained with DAPI (blue). Representative images from three biological replicates are shown. The scale bars represent 20 µm in a and b, 10 µm in d and f, the insets have been enlarged 3-fold
Fig. 7
Fig. 7
Ultrastructural analysis of cells with phages. a, b Transmission electron micrographs of thin sections of kSK-N-SH cells incubated with phages (a) or endosialidase-containing control phages (b) at 37 °C for the times indicated. The arrows indicate examples of surface-bound phage particles. The scale bars represent 100 nm
Fig. 8
Fig. 8
Ultrastructural visualization of internalized phages. Transmission electron micrographs of thin sections of kSK-N-SH cells incubated with biotin-conjugated PK1A2 phages at 37 °C for the times indicated. After incubation, the cells were fixed and stained with Alexa Fluor 488 FluoroNanogold-streptavidin probe, followed by silver-enhanced nanogold and gold toning treatments. Phage particles decorated with enhanced gold particles are seen at the cell surface (arrows) and within cytoplasmic vesicles (arrowheads). The scale bars represent 100 nm

References

    1. Hendrix RW. Bacteriophage genomics. Curr. Opin. Microbiol. 2003;6:506–511. doi: 10.1016/j.mib.2003.09.004. - DOI - PubMed
    1. Suttle CA. Viruses in the sea. Nature. 2005;437:356–361. doi: 10.1038/nature04160. - DOI - PubMed
    1. Clokie MR, Millard AD, Letarov AV, Heaphy S. Phages in nature. Bacteriophage. 2011;1:31–45. doi: 10.4161/bact.1.1.14942. - DOI - PMC - PubMed
    1. Koonin EV. Horizontal gene transfer: essentiality and evolvability in prokaryotes, and roles in evolutionary transitions. F1000Res. 2016;5:1805. doi: 10.12688/f1000research.8737.1. - DOI - PMC - PubMed
    1. Bushman, F. Lateral DNA Transfer: Mechanisms and Consequences (Cold Spring Harbor Laboratory Press, Cold Spring Harbor, New York, 2002).

Publication types

MeSH terms