. 2017 Dec 4;7(1):16901.
doi: 10.1038/s41598-017-17122-6.

Identification of insulin-sensitizing molecules acting by disrupting the interaction between the Insulin Receptor and Grb14

Affiliations

Identification of insulin-sensitizing molecules acting by disrupting the interaction between the Insulin Receptor and Grb14

Anaïs Gondoin et al. Sci Rep. .

Abstract

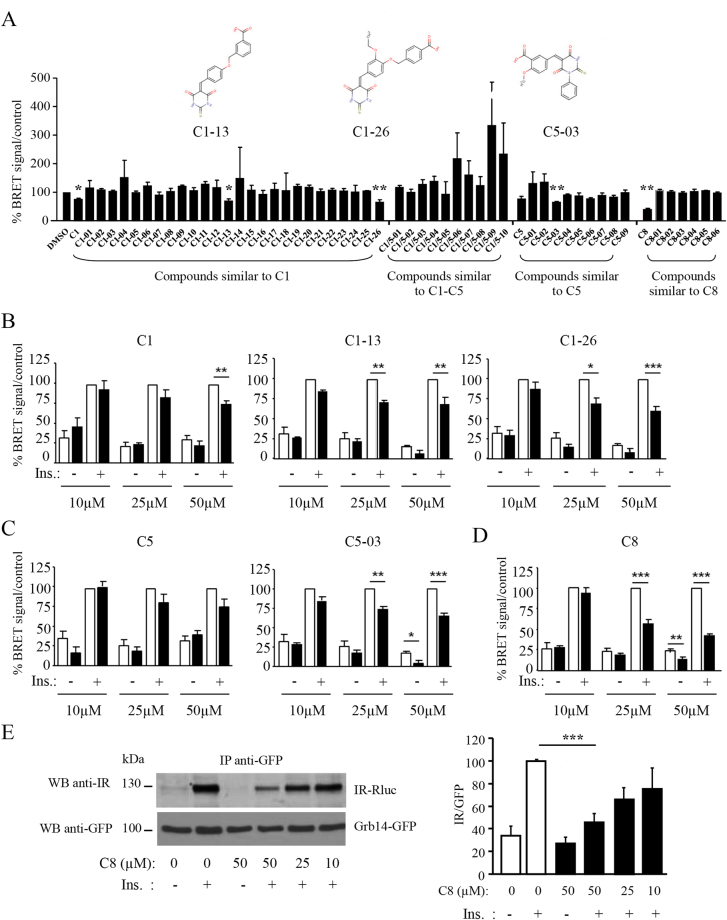
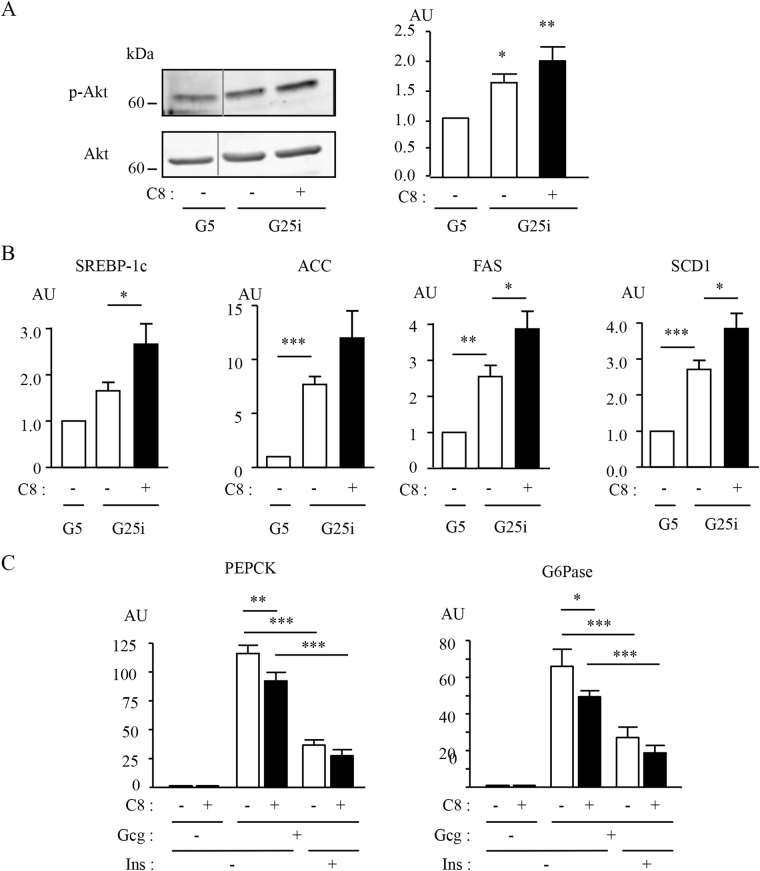
Metabolic diseases are characterized by a decreased action of insulin. During the course of the disease, usual treatments frequently fail and patients are finally submitted to insulinotherapy. There is thus a need for innovative therapeutic strategies to improve insulin action. Growth factor receptor-bound protein 14 (Grb14) is a molecular adapter that specifically binds to the activated insulin receptor (IR) and inhibits its tyrosine kinase activity. Molecules disrupting Grb14-IR binding are therefore potential insulin-sensitizing agents. We used Structure-Based Virtual Ligand Screening to generate a list of 1000 molecules predicted to hinder Grb14-IR binding. Using an acellular bioluminescence resonance energy transfer (BRET) assay, we identified, out of these 1000 molecules, 3 compounds that inhibited Grb14-IR interaction. Their inhibitory effect on insulin-induced Grb14-IR interaction was confirmed in co-immunoprecipitation experiments. The more efficient molecule (C8) was further characterized. C8 increased downstream Ras-Raf and PI3-kinase insulin signaling, as shown by BRET experiments in living cells. Moreover, C8 regulated the expression of insulin target genes in mouse primary hepatocytes. These results indicate that C8, by reducing Grb14-IR interaction, increases insulin signalling. The use of C8 as a lead compound should allow for the development of new molecules of potential therapeutic interest for the treatment of diabetes.


Conflict of interest statement

The authors declare that they have no competing interests.

Figures

Figure 1
Figure 1
Effect of compounds C1, C5 and C8 on IR-Grb14 interaction. (A) Molecular structure of compounds C1, C5 and C8. (B) BRET assays using partially purified IR-RLuc and Grb14-YFP fusion proteins were performed in vitro in the presence of 50 µM of compounds as described in Methods. Results are the means ± SEM of 3 (C1, C5) to 8 (C8) independent experiments and are expressed as percent of BRET signal obtained with insulin-stimulated receptors incubated with control DMSO. (C) IR-Rluc and Grb14-YFP were incubated as in (B). Immunoprecipitation was then performed using an anti-GFP antibody. The amount of IR-RLuc co-precipitated with Grb14-YFP was evaluated by immunoblotting using an anti-IR antibody. Histograms, expressed as percent of control, represent the means ± SEM of the densitometric quantification of 2 (C1, C5) to 8 (C8) independent experiments (**p < 0.01, ***p < 0.001, statistical analysis was performed using ANOVA followed by Bonferroni’s Multiple Comparison Test).
Figure 2
Figure 2
Effect of derivated-compounds on IR-Grb14 BRET interaction. (A) BRET assays were performed in the presence of 50 µM of compounds. Results, expressed as percent of the control DMSO, are the means ± SEM of 3 to 8 independent experiments (*p < 0.01, **p < 0.001 when compared to DMSO, using ANOVA followed by Dunnett Multiple Comparison tests). The structure of the compounds C1-13, C1-26 and C5-03 identified in this assay is shown in the upper part of the panel. (BD) Dose-response experiments using the IR-Grb14 BRET system. Open bars: DMSO control, black bars: compounds added at the indicated concentrations. Results are the means ± SEM of 3 to 8 independent experiments and are expressed as percent of control. (E) Dose-response experiments using anti-GFP immunoprecipitation. Histograms represent the means ± SEM of the densitometric quantification of 3 to 6 independent experiments and are expressed as percent of the value measured in the presence of insulin (*p < 0.05, **p < 0.01, ***p < 0.001, using ANOVA followed by Bonferroni’s Multiple Comparison Test for BE).
Figure 3
Figure 3
Characterization of C8 inhibitory activity. (A) Left part: schematic representation of the three BRET protocols used in this experiment. Right part: Effect of C8 (50 µM) on IR-Grb14 BRET signal in each of the three protocols. Results, expressed as percent of BRET signal obtained with insulin-stimulated receptors incubated with control DMSO, are the means ± SEM of 4 independent experiments (*p < 0.05, **p < 0.01, ***p < 0.001, using ANOVA followed by Bonferroni’s Multiple Comparison Test). (B) Effect of A and B, the two intermediate compounds involved in the last step of C8 synthesis, on the IR-RLuc/Grb14-YFP interaction measured by BRET in vitro. Results, expressed as percent of BRET signal obtained with insulin-stimulated receptors incubated with control DMSO, are the means ± SEM of 3 to 4 independent experiments (***p < 0.001, using ANOVA followed by Bonferroni’s Multiple Comparison Test). (C) Co-immunoprecipitation of the IRTK with Grb14 or Grb10. Cells were co-transfected with either IRTK48-Rluc and Grb14-YFP (left part), or IRTK48-Rluc and YFP-Grb10 (right part), and incubated in the absence or the presence of 50 µM of compound C8 as indicated. Immunoprecipitation was performed using an anti-GFP antibody, and the amount of IRTK-RLuc co-precipitated with Grb14-YFP or YFP-Grb10 was evaluated by immunoblotting using an anti-Luc antibody. Histograms represent the means ± SEM of the densitometric quantification of 3 independent experiments. Results are expressed as percent of control (**p < 0.01, t-test).
Figure 4
Figure 4
C8 did not directly activate the IR. (A) Left panel: schematic representation of the IR conformational change induced by insulin. Right panel: BRET assays were performed in vitro in the absence or in the presence of 5 nM insulin and 50 µM of compound C8 as described in Methods. Results (increase BRET signal above basal) are the means ± SEM of 3 independent experiments. (B) Autophosphorylation of partially purified fusion receptors was performed as described in Methods in the absence or the presence of 50 µM C8 and 5 nM insulin. Autophosphorylation of the receptor-fusion protein was detected by immunoblotting using an antiphosphotyrosine antibody. Histograms represent the means ± SEM of the densitometric quantification of 3 independent experiments (*p < 0.05, using ANOVA followed by Newman-Keuls Multiple Comparison Test). (C) HEK-293T cells were lysed and endogenous receptors were immunoprecipitated (IP) with an anti-IR antibody and protein G-sepharose beads. Autophosphorylation was detected by immunoblotting using an antibody directed against the three phosphotyrosines of the kinase domain.
Figure 5
Figure 5
Activation of the Ras/Raf pathway by C8 in intact cells. (A) Schematic representation of the BRET assay used in this experiment. (B) Typical experiment showing BRET signal monitored during 36 min in HEK-293T cells co-expressing the Ras Binding Domain of Raf fused to the Renilla luciferase (Raf-RBD-RLuc) and either WT or mutated pEYFP-RasN17. Cells were stimulated or not with 5 nM of insulin and compound C8 (50 µM) as indicated. (C) Quantification of insulin-induced BRET (increase BRET above basal). Results are the means ± SEM of 4 independent experiments (*p < 0.05, **p < 0.01, using ANOVA followed by Newman-Keuls Multiple Comparison test).
Figure 6
Figure 6
Activation of the PI3K/Akt pathway by C8 in intact cells. (A) Schematic representation of the BRET assay used in this experiment. (B) Typical experiment showing real-time insulin and C8 effects on PIP3 production in HEK-293T cells. (C) Insulin-induced BRET and effect of C8 on the translocation of Akt to the plasma membrane (increase BRET mBU above basal). (D) Dose-dependent effect of compound C8 on PIP3 production (increase BRET mBU above basal). Results are the means ± SEM of 3 to 8 independent experiments (**p < 0.01, ***p < 0.001, using ANOVA followed by Newman-Keuls (C) or Dunnett Multiple Comparison tests (D)).
Figure 7
Figure 7
Effect of C8 on downstream biological effects of insulin. (A) Effect of C8 on Akt phosphorylation in primary hepatocytes. Primary mouse hepatocytes were cultured for 24 h in the presence of 5 mM glucose (G5) or 25 mM glucose and 10 nM insulin (G25i), with or without 50 µM of compound C8 as indicated. Cell lysates were analyzed by Western blotting using the indicated antibodies. The grey lines indicate a cropped lane of the original blots. The uncropped blots are shown in Supplementary Fig. 5. Histograms represent the means ± SEM of the densitometric quantification of 3 independent experiments. (B) Expression of lipogenic genes. Primary mouse hepatocytes were cultured for 24 h in the presence of G5 or G25i with or without 50 µM of compound C8. mRNA expression level was measured by qRT-PCR. Results are normalized to the expression of 18S mRNA and correspond to the means ± SEM of 3 to 5 independent experiments. (C) Expression of gluconeogenic insulin target genes. Primary hepatocytes were preincubated 1 h in the presence of 5 mM glucose with or without 10 nM glucagon and treated for 8 h in the absence or presence of 1 nM insulin and 50 µM of compound C8. mRNA expression was measured as in (B). Statistical analysis was performed using ANOVA followed by Dunnett (A) or Newman-Keuls Multiple Comparison tests (B,C) (*p < 0.05, **p < 0.01, ***p < 0.001) AU: arbitrary units.

Similar articles

Cited by

References

    1. Kahn SE, Hull RL, Utzschneider KM. Mechanisms linking obesity to insulin resistance and type 2 diabetes. Nature. 2006;444:840–846. doi: 10.1038/nature05482. - DOI - PubMed
    1. Sherwin R, Jastreboff AM. Year in diabetes 2012: The diabetes tsunami. The Journal of clinical endocrinology and metabolism. 2012;97:4293–4301. doi: 10.1210/jc.2012-3487. - DOI - PMC - PubMed
    1. Samuel VT, Shulman GI. Mechanisms for insulin resistance: common threads and missing links. Cell. 2012;148:852–871. doi: 10.1016/j.cell.2012.02.017. - DOI - PMC - PubMed
    1. Taniguchi CM, Emanuelli B, Kahn CR. Critical nodes in signalling pathways: insights into insulin action. Nature reviews. 2006;7:85–96. doi: 10.1038/nrm1837. - DOI - PubMed
    1. Combettes-Souverain M, Issad T. Molecular basis of insulin action. Diabetes Metab. 1998;24:477–489. - PubMed

Publication types

MeSH terms