

Environmental DNA reveals tropical shark diversity in contrasting levels of anthropogenic impact
- PMID: 29203793
- PMCID: PMC5715122
- DOI: 10.1038/s41598-017-17150-2
Environmental DNA reveals tropical shark diversity in contrasting levels of anthropogenic impact
Abstract
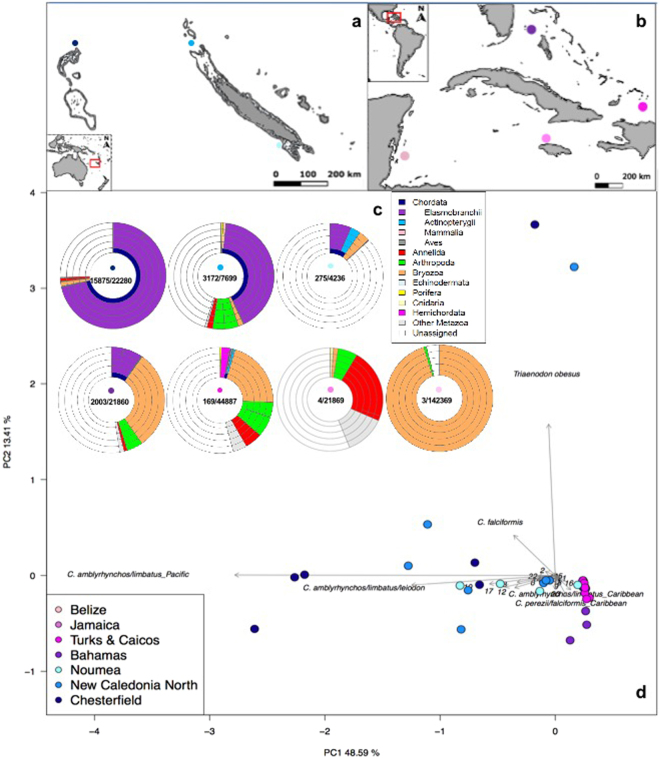
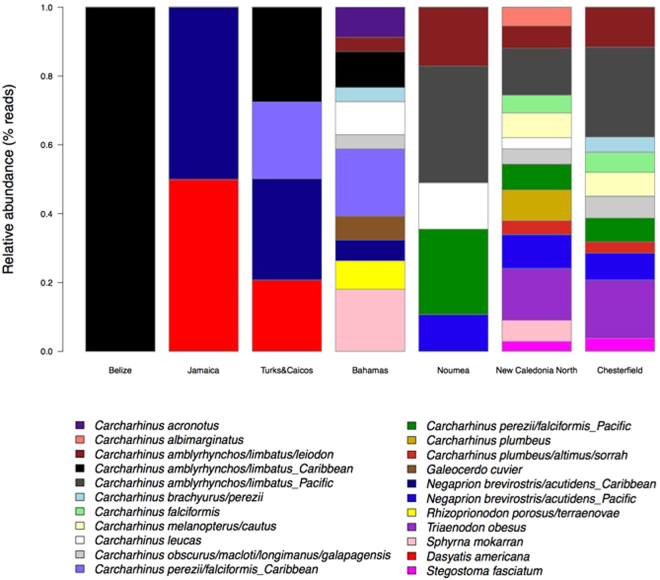
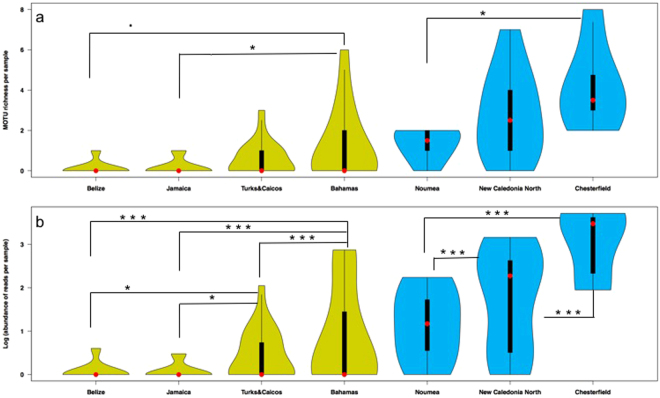
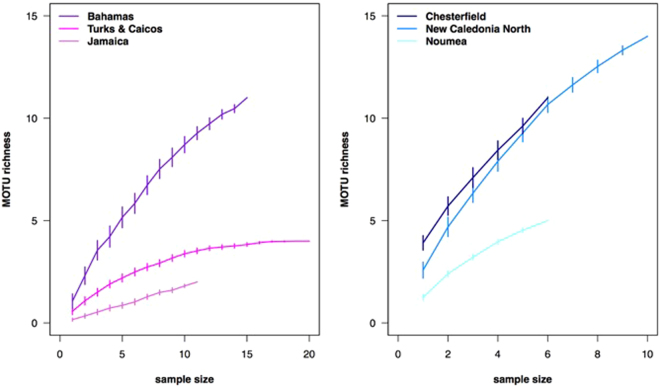
Sharks are charismatic predators that play a key role in most marine food webs. Their demonstrated vulnerability to exploitation has recently turned them into flagship species in ocean conservation. Yet, the assessment and monitoring of the distribution and abundance of such mobile species in marine environments remain challenging, often invasive and resource-intensive. Here we pilot a novel, rapid and non-invasive environmental DNA (eDNA) metabarcoding approach specifically targeted to infer shark presence, diversity and eDNA read abundance in tropical habitats. We identified at least 21 shark species, from both Caribbean and Pacific Coral Sea water samples, whose geographical patterns of diversity and read abundance coincide with geographical differences in levels of anthropogenic pressure and conservation effort. We demonstrate that eDNA metabarcoding can be effectively employed to study shark diversity. Further developments in this field have the potential to drastically enhance our ability to assess and monitor elusive oceanic predators, and lead to improved conservation strategies.
Conflict of interest statement
The authors declare that they have no competing interests.
Figures
Similar articles
-
Environmental DNA (eDNA) metabarcoding reveals strong discrimination among diverse marine habitats connected by water movement.Mol Ecol Resour. 2019 Mar;19(2):426-438. doi: 10.1111/1755-0998.12982. Mol Ecol Resour. 2019. PMID: 30576077
-
Seeing through sedimented waters: environmental DNA reduces the phantom diversity of sharks and rays in turbid marine habitats.BMC Ecol Evol. 2021 Sep 6;21(1):166. doi: 10.1186/s12862-021-01895-6. BMC Ecol Evol. 2021. PMID: 34488638 Free PMC article.
-
Using vertebrate environmental DNA from seawater in biomonitoring of marine habitats.Conserv Biol. 2020 Jun;34(3):697-710. doi: 10.1111/cobi.13437. Epub 2019 Dec 24. Conserv Biol. 2020. PMID: 31729081 Free PMC article.
-
Environmental DNA Metabarcoding: A Novel Method for Biodiversity Monitoring of Marine Fish Communities.Ann Rev Mar Sci. 2022 Jan 3;14:161-185. doi: 10.1146/annurev-marine-041421-082251. Epub 2021 Aug 5. Ann Rev Mar Sci. 2022. PMID: 34351788 Review.
-
Environmental DNA metabarcoding: Transforming how we survey animal and plant communities.Mol Ecol. 2017 Nov;26(21):5872-5895. doi: 10.1111/mec.14350. Epub 2017 Oct 26. Mol Ecol. 2017. PMID: 28921802 Review.
Cited by
-
A DNA barcode reference library of French Polynesian shore fishes.Sci Data. 2019 Jul 4;6(1):114. doi: 10.1038/s41597-019-0123-5. Sci Data. 2019. PMID: 31273217 Free PMC article.
-
Environmental DNA reveals the fine-grained and hierarchical spatial structure of kelp forest fish communities.Sci Rep. 2021 Jul 14;11(1):14439. doi: 10.1038/s41598-021-93859-5. Sci Rep. 2021. PMID: 34262101 Free PMC article.
-
Environmental DNA detection tracks established seasonal occurrence of blacktip sharks (Carcharhinus limbatus) in a semi-enclosed subtropical bay.Sci Rep. 2020 Jul 16;10(1):11847. doi: 10.1038/s41598-020-68843-0. Sci Rep. 2020. PMID: 32678294 Free PMC article.
-
Environmental DNA from Marine Waters and Substrates: Protocols for Sampling and eDNA Extraction.Methods Mol Biol. 2022;2498:225-251. doi: 10.1007/978-1-0716-2313-8_11. Methods Mol Biol. 2022. PMID: 35727547
-
Comparison of qPCR and metabarcoding for environmental DNA surveillance of a freshwater parasite.Ecol Evol. 2024 May 6;14(5):e11382. doi: 10.1002/ece3.11382. eCollection 2024 May. Ecol Evol. 2024. PMID: 38716167 Free PMC article.
References
-
- Mullon C, Freon P, Cury P. The dynamcis of collapse in world fisheries. Fish Fish. 2005;6:111–120. doi: 10.1111/j.1467-2979.2005.00181.x. - DOI
-
- Camhi, M. D., Valenti, S. V., Fordham, S. V., Fowler, S. L. & Gibson, C. The conservation status of pelagic sharks and rays, IUCN Species Survival Commission’s Shark Specialist Group. 19–23, doi:978-0-9561063-1-5 (2009).
Publication types
MeSH terms
Substances
LinkOut - more resources
Full Text Sources
Other Literature Sources
