. 2018 Feb;26(2):265-274.
doi: 10.1038/s41431-017-0041-y. Epub 2017 Dec 4.

Bayesian analysis of genome-wide inflammatory bowel disease data sets reveals new risk loci

Affiliations

Bayesian analysis of genome-wide inflammatory bowel disease data sets reveals new risk loci

Yu Zhang et al. Eur J Hum Genet. 2018 Feb.

Abstract

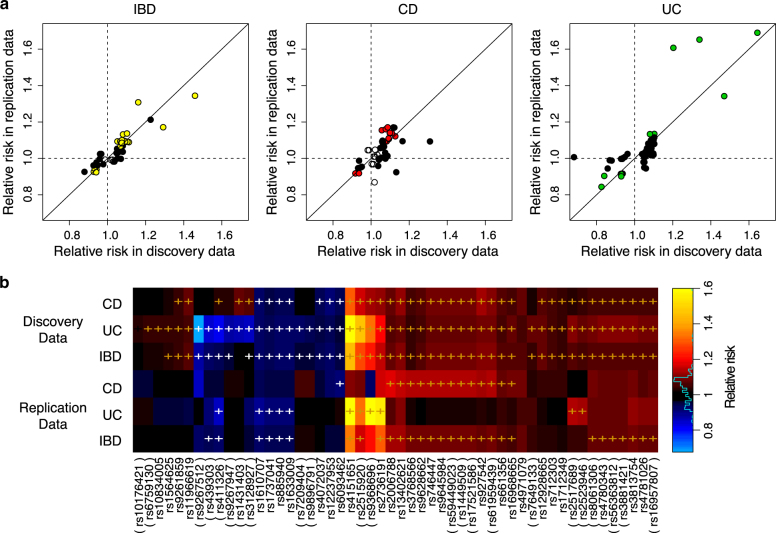
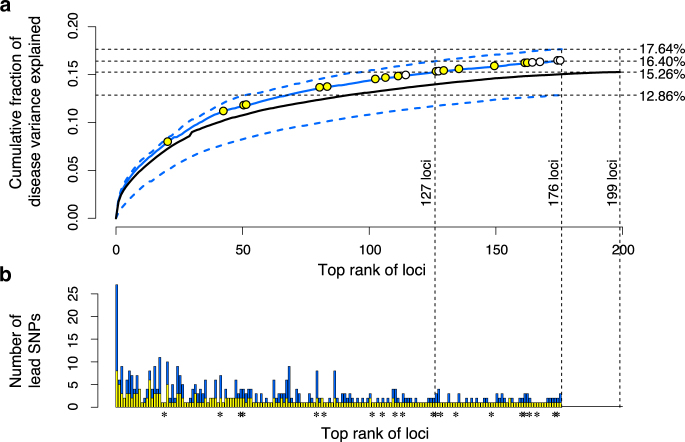
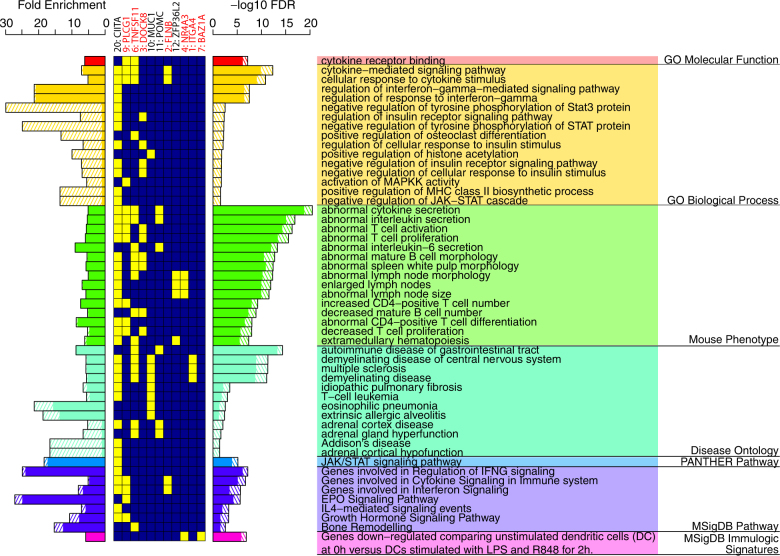
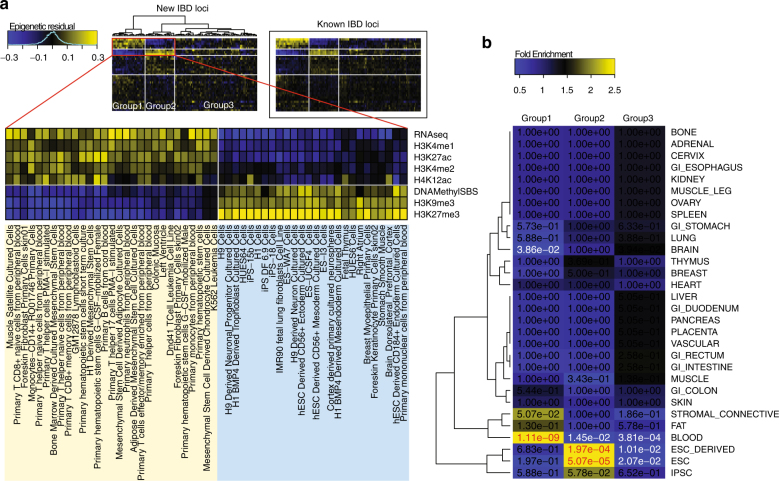
Genome-wide association studies (GWAS) have identified and validated 200 risk loci for inflammatory bowel disease (IBD) to date, including risk loci for both Crohn's disease and ulcerative colitis. Previously studies mainly used single SNP testing methods and only reported the most significant association within each locus. Advanced methods are needed to detect additional joint effects of multiple SNPs and fine map causal variants in presence of strong linkage disequilibrium. In this study, we applied a powerful Bayesian method to analyze an existing Immunochip data sets for IBD from the international inflammatory bowel disease genetics consortium. The method jointly tested single and set-based SNPs in a unified framework and filtered indirect associations due to linkage disequilibrium, thereby fine-mapping the most likely IBD variants. Using an independent collection of individuals from 11 IBD GWAS as validation, our approach discovered and validated 9 completely new IBD loci and 5 independent signals (excluding the major histocompatibility complex) near known IBD loci reaching genome-wide significance. Several of the replicated new loci implicated functionally more interpretable genes than previous reports. The epigenetic marks at our detected IBD signals demonstrated significant activation signatures in blood cell types and correspondingly substantial repression in stem cells, suggesting regulatory links between genetic variants and IBD. Our analysis of the currently largest IBD datasets therefore added new insights that will be integral to the ongoing efforts in IBD genetics.


Conflict of interest statement

The authors declare that they have no competing interests.

Figures

Fig. 1
Fig. 1
Replication of relative risks. a Scatter plots show the relative risks of minor alleles of each lead SNP in the replicated new loci or new SNPs near known loci. Colored dots denote SNPs with significant marginal effects at 0.05 level in both discovery and replication data; solid black dots denote SNPs with significant marginal effects in discovery data but not in replication data; empty dots denote SNPs with insignificant marginal effects in discovery data. b The same relative risks of minor alleles of the lead SNPs in the replicated new loci shown in heatmap, comparing between CD, UC and subtypes combined (IBD). ‘ + ’ marks the significant marginal effects at 0.05 level. SNP ID in parenthesis indicates lead SNPs for either CD or UC, but not for IBD, in the discovery data
Fig. 2
Fig. 2
Proportion of disease variance explained by the lead IBD SNPs. a Cumulative fractions (generalized r 2) of IBD variance explained by the lead SNPs after removing sample stratification. Solid blue line shows the fraction explained by the 250 direct lead SNPs in 176 loci detected by BEAM3. Upper dotted blue line shows the fraction explained by including all 504 lead SNPs detected by BEAM3. Lower dotted blue line shows the fraction explained by the single best lead SNPs in 176 loci. Yellow circles mark the replicated new IBD loci or IBD signals near known loci, and white circles mark the replicated new loci or new signals near known loci for either CD or UC, but not combined. Black solid line shows the fraction of IBD variance explained by the 231 previously reported lead SNPs in 200 known IBD loci. The corresponding r 2 s for each model were shown on the right side. b Total number of lead SNPs and the estimated number of direct lead SNPs in each of the 176 loci detected by BEAM3. Stars indicate the replicated new loci or new signals near known loci
Fig. 3
Fig. 3
Gene function and pathway enrichment analysis for the replicated new IBD loci. Solid bars denote enrichments obtained from the recaptured known IBD loci. Bars in shaded lines denote additional enrichments due to inclusion of our replicated new loci. Enriched terms are ranked by FDR within each category, and only the top 15 most significant terms in each category are shown. Yellow and blue boxes in the center show the involvement (yellow boxes) of each locus in the enriched terms. Loci not enriched in any of the shown terms are removed. Best candidate genes implicated in the enriched terms for each locus (new loci or new signals at known loci), and the locus index, are shown on the top. New loci are marked by asteroid. MHC region (chr6:29–34 Mb) is removed from this analysis
Fig. 4
Fig. 4
Enrichment pattern of epigenetic marks. Using 34 epigenetic marks in 127 epigenomes from RoadMap Epigenomics, we calculated mean signals (in log scale) of each mark in each cell type at our detected IBD lead SNPs. We adjusted for SNP density and subtracted mean signals of corresponding marks and cell types at all non-IBD SNPs (see Methods). We further removed mark effects and cell type effects to obtain residual signals. a Heatmap of the residual signals at the lead SNPs in the 22 novel IBD loci or new signals near known loci. We observed a clear enrichment pattern that separated the 127 epigenomes into three groups, with the first two groups and a subset of epigenetic marks showing in the zoomed view. Heatmap of the residual signals at known IBD loci is shown in the boxed area for comparison. b Fold enrichment of cell type anatomy in the three epigenome groups marked in (a), with fisher’s exact p-values for enrichment showing in the heatmap. Significant p-values for enrichment and depletion of cell type anatomy are shown in red and white colors, respectively

References

    1. Molodecky NA, Soon IS, Rabi DM, et al. Increasing incidence and prevalence of the inflammatory bowel diseases with time, based on systematic review. Gastroenterology. 2012;142:46–54. doi: 10.1053/j.gastro.2011.10.001. - DOI - PubMed
    1. Ng SC, Tang W, Ching JY, et al. Incidence and phenotype of inflammatory bowel disease based on results from the Asia-Pacific Crohn’s and Colitis Epidemiology Study. Gastroenterology. 2013;145:158–65. doi: 10.1053/j.gastro.2013.04.007. - DOI - PubMed
    1. Barrett JC, Hansoul S, Nicolae DL, et al. Genome-wide association defines more than 30 distinct susceptibility loci for Crohn’s disease. Nat Genet. 2008;40:955–62. doi: 10.1038/ng.175. - DOI - PMC - PubMed
    1. Franke A, McGovern DP, Barrett JC, et al. Genome-wide meta-analysis increases to 71 the number of confirmed Crohn’s disease susceptibility loci. Nat Genet. 2010;42:1118–25. doi: 10.1038/ng.717. - DOI - PMC - PubMed
    1. Anderson CA, Boucher G, Lees CW, et al. Meta-analysis identifies 29 additional ulcerative colitis risk loci, increasing the number of confirmed associations to 47. Nat Genet. 2011;43:246–52. doi: 10.1038/ng.764. - DOI - PMC - PubMed

Publication types

LinkOut - more resources