. 2017 Dec 4;7(1):16839.
doi: 10.1038/s41598-017-16829-w.

Age-dependent increase of oxidative stress regulates microRNA-29 family preserving cardiac health

Affiliations

Age-dependent increase of oxidative stress regulates microRNA-29 family preserving cardiac health

Johanna Heid et al. Sci Rep. .

Abstract

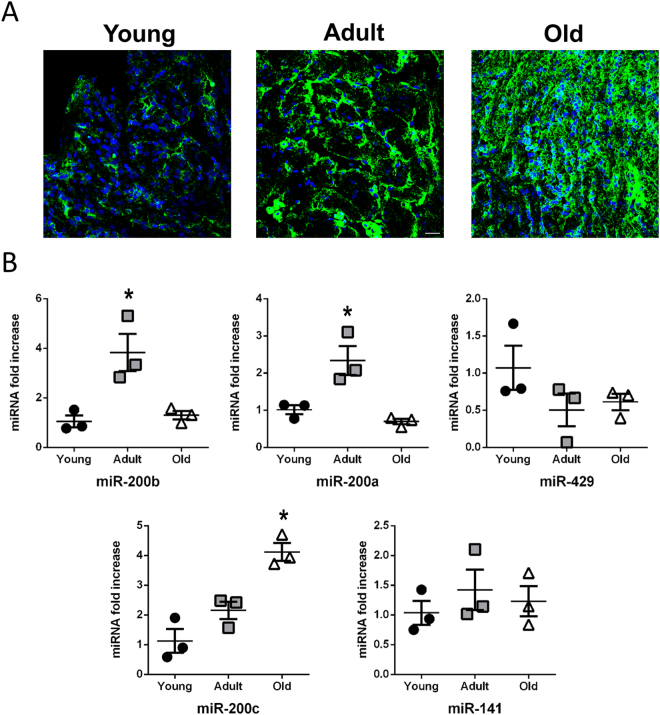
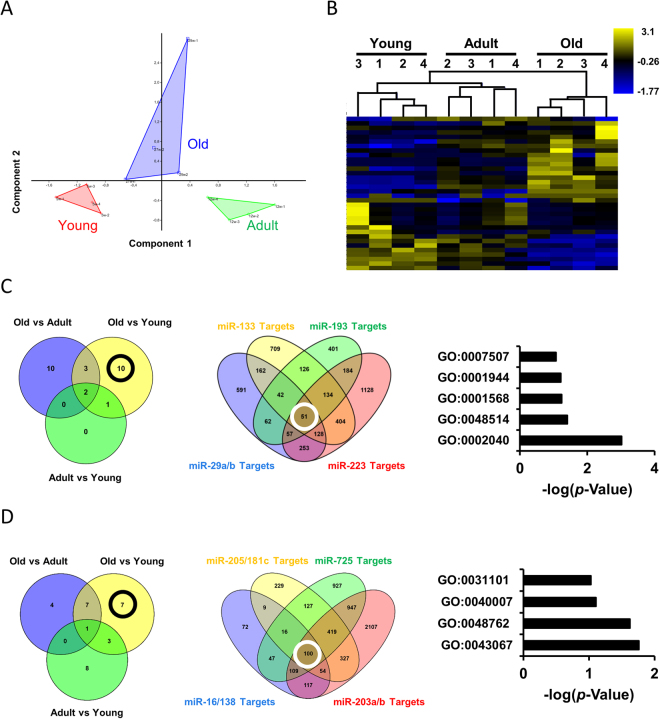
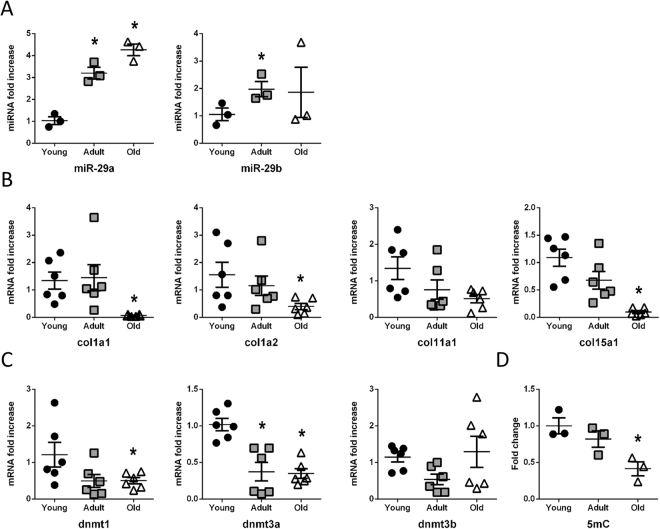
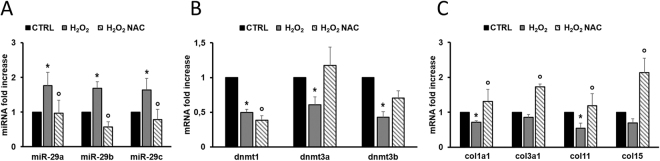
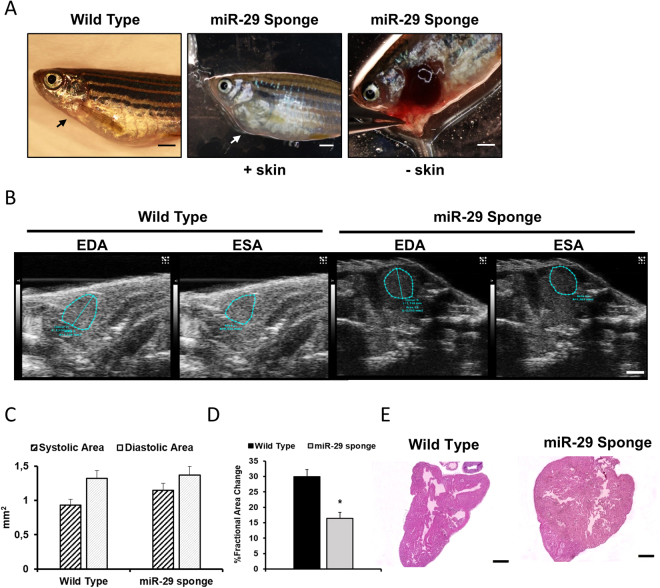
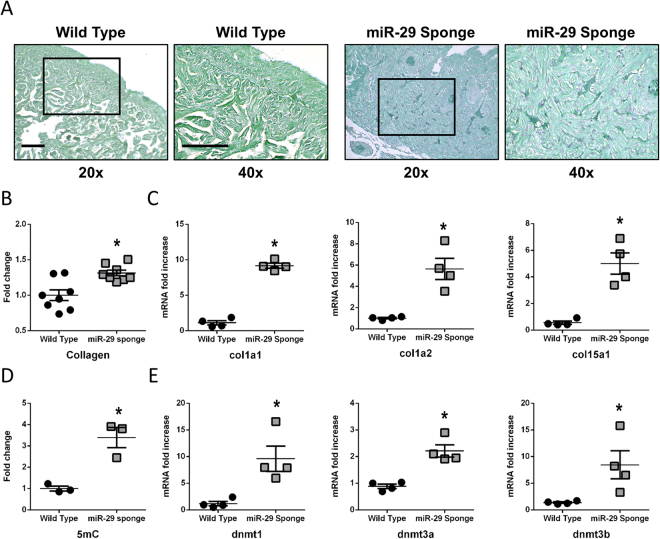
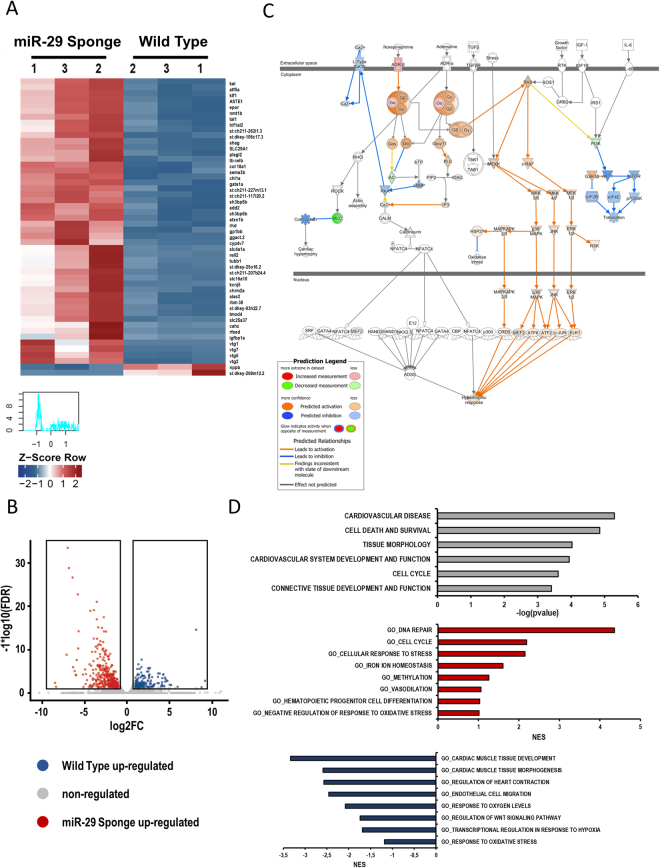
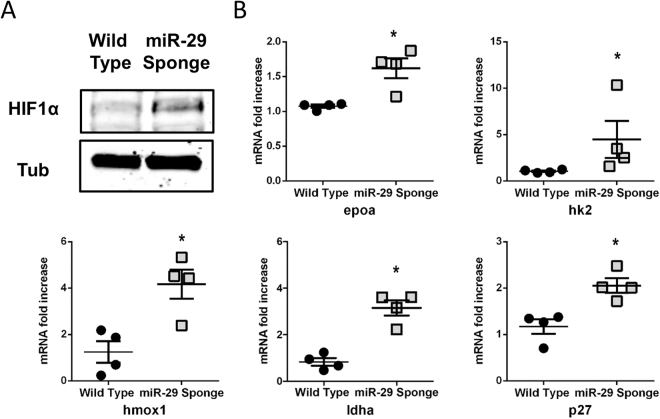
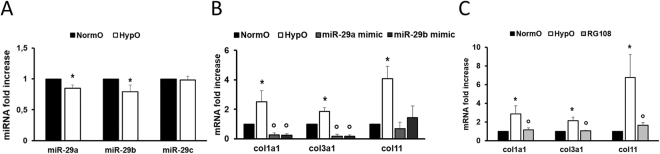
The short-lived turquoise killifish Nothobranchius furzeri (Nfu) is a valid model for aging studies. Here, we investigated its age-associated cardiac function. We observed oxidative stress accumulation and an engagement of microRNAs (miRNAs) in the aging heart. MiRNA-sequencing of 5 week (young), 12-21 week (adult) and 28-40 week (old) Nfu hearts revealed 23 up-regulated and 18 down-regulated miRNAs with age. MiR-29 family turned out as one of the most up-regulated miRNAs during aging. MiR-29 family increase induces a decrease of known targets like collagens and DNA methyl transferases (DNMTs) paralleled by 5´methyl-cytosine (5mC) level decrease. To further investigate miR-29 family role in the fish heart we generated a transgenic zebrafish model where miR-29 was knocked-down. In this model we found significant morphological and functional cardiac alterations and an impairment of oxygen dependent pathways by transcriptome analysis leading to hypoxic marker up-regulation. To get insights the possible hypoxic regulation of miR-29 family, we exposed human cardiac fibroblasts to 1% O2 levels. In hypoxic condition we found miR-29 down-modulation responsible for the accumulation of collagens and 5mC. Overall, our data suggest that miR-29 family up-regulation might represent an endogenous mechanism aimed at ameliorating the age-dependent cardiac damage leading to hypertrophy and fibrosis.


Conflict of interest statement

The authors declare that they have no competing interests.

Figures

Figure 1
Figure 1
Oxidative stress accumulates in the aging heart of N. furzeri. (A) Representative confocal microscopy images of nitrotyrosine staining (green) in young (left panel), adult (middle panel) and old (right panel) Nfu hearts. Nuclei were counterstained with DAPI (blue). Calibration bar = 15 µm. (B) qRT-PCR analysis of miR-200 family members in young (black circles), adult (gray squares) and old (white triangle) Nfu hearts expressed as fold increase versus young samples (n = 3 at each age). *p < 0.05 Vs young.
Figure 2
Figure 2
Aging regulates specific miRNAs in the heart of N. furzeri. (A) Principal Component Analysis (PCA) of miRNAs in young (5 weeks; red triangle), adult (12 weeks; green triangle) and old (27–29 weeks; blue triangle) Nfu hearts (n = 4 at each age). (B) Hierarchical clustering of miRNAs regulated more than ± 1.3 log2 fold change. Yellow and blue represent under- and over-expressed genes, respectively. (n = 4 at each age). (C) Venn diagrams depicting the distribution of up-regulated (left panel) miRNAs among young, adult or old Nfu hearts. Venn diagrams depicting the distribution of miR-133, miR-193, miR-29a/b, miR-223 predicted targets (middle panel). Gene ontology analysis of 51 common predicted targets (right panel). GO:0002040 sprouting angiogenesis; GO:0048514 blood vessel morphogenesis; GO:0001568 blood vessel development; GO:0001944 vasculature development; GO:0007507 heart development (D) Venn diagrams depicting the distribution of down-regulated (left panel) miRNAs among young, adult or old Nfu hearts. Venn diagrams depicting the distribution of miR-205/181c, miR-725, miR16/138, miR-203a/b predicted targets (middle panel). Gene ontology analysis of 100 common predicted targets (right panel). GO:0043067 regulation of programmed cell death, GO:0048762 mesenchymal cell differentiation; GO:0040007 growth; GO:0031101 fin regeneration.
Figure 3
Figure 3
Age-dependent miR-29 family up-regulation affects collagen and methylation levels in N. furzeri heart. (A) qRT-PCR analysis of miR-29 family members in young (black circles), adult (gray squares) and old (white triangles) Nfu hearts expressed as fold increase versus young samples (n = 3 at each age). (B) qRT-PCR analysis of collagen mRNAs in young (black circles; n = 6), adult (gray squares; n = 6) and old (white triangles; n = 6) Nfu hearts expressed as fold increase versus young samples. (C) qRT-PCR analysis of DNA methyl transferases mRNAs (dnmts) in young (black circles; n = 6), adult (gray squares; n = 6) and old (white triangles; n = 6) Nfu hearts expressed as fold-change versus young samples. (D) Global DNA methylation quantification of 5-methyl cytosine (5mC) in young (black circles), adult (gray squares) and old (white triangles) Nfu hearts (n = 3 at each age). *p < 0.05 Vs young.
Figure 4
Figure 4
Oxidative stress affects miR-29 family and its targets. (A) qRT-PCR analysis of miR-29 family members in human cardiac fibroblasts (HCF) cultured in control conditions (CTRL; black bars; n = 7), in the presence of H2O2 (gray bars; n = 7) and of H2O2 + NAC (striped bars; n = 6) expressed as fold-change versus control samples. (B) qRT-PCR analysis of dnmt mRNAs in human cardiac fibroblasts (HCF) cultured in control conditions (CTRL; black bars; n = 8), in the presence of H2O2 (gray bars; n = 8) and of H2O2 + NAC (striped black bars; n = 4) expressed as fold-change versus control samples. (C) qRT-PCR analysis of collagen mRNAs in human cardiac fibroblasts (HCF) cultured in control conditions (CTRL; black bars; n = 8), in the presence of H2O2 (gray bars; n = 8) and of H2O2 + NAC (striped black bars; n = 4) expressed as fold-change versus control samples. *p < 0.05 Vs control; °p < 0.05 Vs H2O2.
Figure 5
Figure 5
miR-29 family knock-down induces morphological and physiological changes in the heart of Zebrafish. (A) Representative images of Wild Type Zebrafish (left panel) and miR-29-sponge Zebrafish: view from outside (middle panel (+skin)) and with open chest (right panel (−skin)). Note the convexity in the cardiac region of miR-29 Sponge animal compared to Wild Type (black arrow) indicated by the white arrow. Calibration bar = 1 mm (B) Representative echocardiography of Wild Type (left panels) and miR-29-sponge (right panels) Zebrafish hearts showing end-diastolic area (EDA; first and third panel) and end-systolic area (ESA; second and fourth panel) Calibration bar = 1 mm. (C) Graph shows systolic area (black striped bars) and diastolic area (light gray bars) in Zebrafish hearts of Wild Type (n = 9) and miR-29-sponge Zebrafish (n = 13). (D) Graph shows Fractional Area Change (FAC) in Wild Type (black bar; n = 9) and miR-29-sponge (gray bar; n = 13) Zebrafish hearts. (E) Representative hematoxylin eosin staining in Wild Type (left panel) and miR-29-sponge (right panel) Zebrafish ventricles. Calibration bar = 100 µm. (D) *p < 0.05 Vs Wild Type.
Figure 6
Figure 6
miR-29 family knock-down associates with collagen deposition and DNA methylation increase in the Zebrafish heart. (A) Representative Fast Green Sirius Red staining of Wild Type (left panels) and miR-29-sponge (right panels) Zebrafish ventricles. Collagenous proteins are depicted in light purple and non-collagenous proteins in green. Magnification: 20x in first and third panel and 40x in second and fourth panel. Calibration bar = 25 µm (B) Collagen deposition quantification in sections derived from Wild Type (black circles; n = 8) and miR-29-sponge (gray squares; n = 8) Zebrafish hearts. (C) qRT-PCR analysis of collagen mRNAs in Wild Type (black circles; n = 4) and miR-29-sponge (gray squares; n = 4) Zebrafish hearts expressed as fold increase versus Wild Type samples. (D) Global DNA methylation quantification of 5mC in Wild Type (black circles; n = 3) and miR-29-sponge (gray squares; n = 3) Zebrafish hearts expressed as fold-change versus Wild Type samples. (E) qRT-PCR analysis of dnmt mRNAs in Wild Type (black circles; n = 4) and miR-29-sponge (gray squares; n = 4) Zebrafish hearts expressed as fold increase versus Wild Type samples. *p < 0.05 Vs Wild Type.
Figure 7
Figure 7
Identification of miR-29 associated cardiac transcriptome. (A) Heatmap showing the 50 most differentially regulated genes in the heart of Wild Type and miR-29-sponge Zebrafish identified by total RNA sequencing analysis. Red and blue represent over- and under-expressed genes, respectively. List of genes is provided also in supplemental table 5. (B) Volcano plot of differentially regulated genes expressed in the heart of Wild Type and miR-29-sponge Zebrafish. Red dots show miR-29-sponge up-regulated genes, blue dots show Wild Type up-regulated genes. (C) Canonical pathway analysis of Ingenuity Pathway Analysis prediction for hypertrophic response activation. Orange shapes represent activation; blue shapes represents inhibition. The intensity of color represents the degree of prediction. (D) Disease pathway analysis of modulated genes in miR-29-sponge Zebrafish (gray bars). Biological function gene ontology of up-regulated genes in miR-29-sponge Zebrafish hearts (red bars). Biological function gene ontology of genes up-regulated genes in Wild Type Zebrafish hearts (blue bars).
Figure 8
Figure 8
Hypoxic markers accumulate in miR-29-sponge Zebrafish hearts. (A) Representative western blot analysis of hypoxia inducible factor 1α (HIF1α) expression in Wild Type and miR-29-sponge Zebrafish heart. In each condition, α-tubulin was used as loading control. Three independent experiments were performed. Full-length blot is presented in Supplementary Figure 6.(B) qRT-PCR mRNA analysis of hypoxia associated genes: erythropoietin alpha (epoa); hexokinase2 (hk2); heme oxygenase1a (hmox1a); lactate dehydrogenase A (ldha); cyclin-dependent kinase inhibitor 1B (p27) in Wild Type (black circles; n = 4) and miR-29-sponge (gray squares; n = 4) Zebrafish hearts expressed as fold-change versus Wild Type samples. *p < 0.05 Vs Wild Type.
Figure 9
Figure 9
Hypoxia affects miR-29 family and its related targets. (A) qRT-PCR analysis of miR-29 family members in HCFs under normoxic conditions (NormO; black bars) and 48 h hypoxia (HypO; white bars; n = 7) expressed as fold-change versus normoxic samples. (B) qRT-PCR analysis of col mRNAs in HCFs under normoxic conditions (NormO; black bars; n = 6), under hypoxia prior (HypO; white bars; n = 6) and after transfection with miR-29a mimic (miR-29a; gray bar; n = 3) or miR-29b mimic (miR-29b; dark gray bar; n = 3) expressed as fold increase versus normoxic samples. (C) qRT-PCR analysis of col mRNAs in HCFs under normoxic conditions (NormO; black bars), under hypoxia in the absence (HypO; white bars) or presence of RG108 (RG108; gray bar) expressed as fold increase versus normoxic samples (n = 5). *p < 0.05 Vs normoxia; °p < 0.05 Vs hypoxia).

Similar articles

Cited by

References

    1. Lutz W, Sanderson W, Scherbov S. The coming acceleration of global population ageing. Nature. 2008;451:716–719. doi: 10.1038/nature06516. - DOI - PubMed
    1. Martin GM. The biology of aging: 1985-2010 and beyond. FASEB journal: official publication of the Federation of American Societies for Experimental Biology. 2011;25:3756–3762. doi: 10.1096/fj.11-1102.ufm. - DOI - PMC - PubMed
    1. Olshansky SJ, Goldman DP, Zheng Y, Rowe JW. Aging in America in the twenty-first century: demographic forecasts from the MacArthur Foundation Research Network on an Aging Society. The Milbank quarterly. 2009;87:842–862. doi: 10.1111/j.1468-0009.2009.00581.x. - DOI - PMC - PubMed
    1. Hayflick L. Biological aging is no longer an unsolved problem. Annals of the New York Academy of Sciences. 2007;1100:1–13. doi: 10.1196/annals.1395.001. - DOI - PubMed
    1. Kirkwood TB. Understanding the odd science of aging. Cell. 2005;120:437–447. doi: 10.1016/j.cell.2005.01.027. - DOI - PubMed

Publication types

MeSH terms