. 2018 Apr;21(1):113-125.
doi: 10.1038/s41391-017-0013-x. Epub 2017 Dec 4.

Combining intratumoral Treg depletion with androgen deprivation therapy (ADT): preclinical activity in the Myc-CaP model

Affiliations

Combining intratumoral Treg depletion with androgen deprivation therapy (ADT): preclinical activity in the Myc-CaP model

Ying-Chun Shen et al. Prostate Cancer Prostatic Dis. 2018 Apr.

Abstract

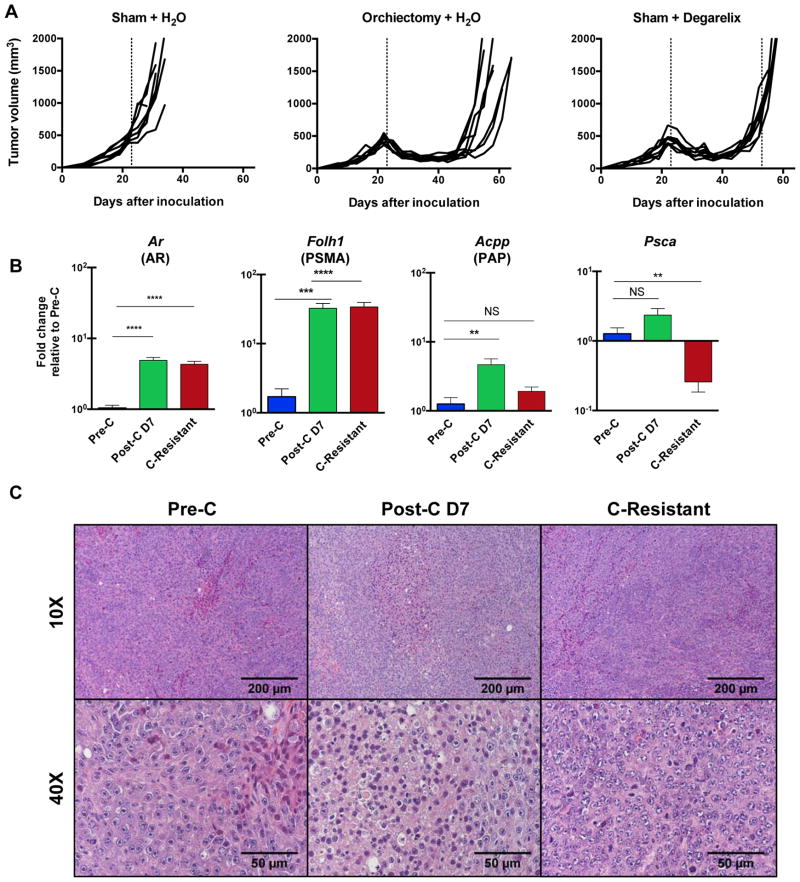
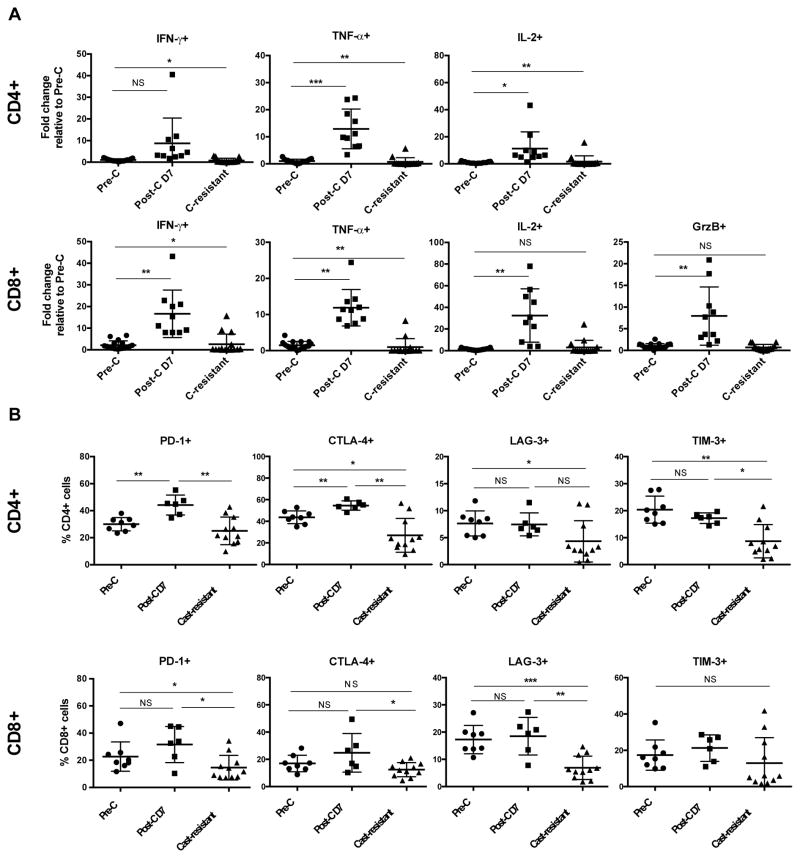
Background: Immune checkpoint blockade has shown promising antitumor activity against a variety of tumor types. However, responses in castration-resistant prostate cancer remain relatively rare-potentially due to low baseline levels of infiltration. Using an immunocompetent cMyc-driven model (Myc-CaP), we sought to understand the immune infiltrate induced by androgen deprivation therapy (ADT) and to leverage that infiltration toward therapeutic benefit.

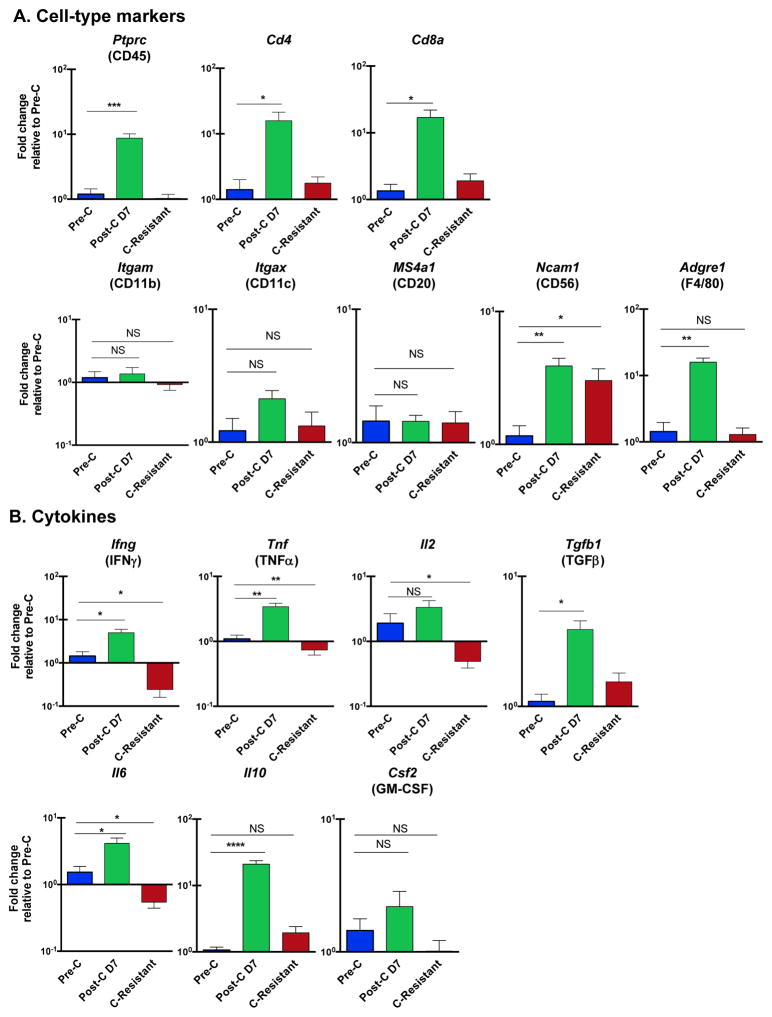
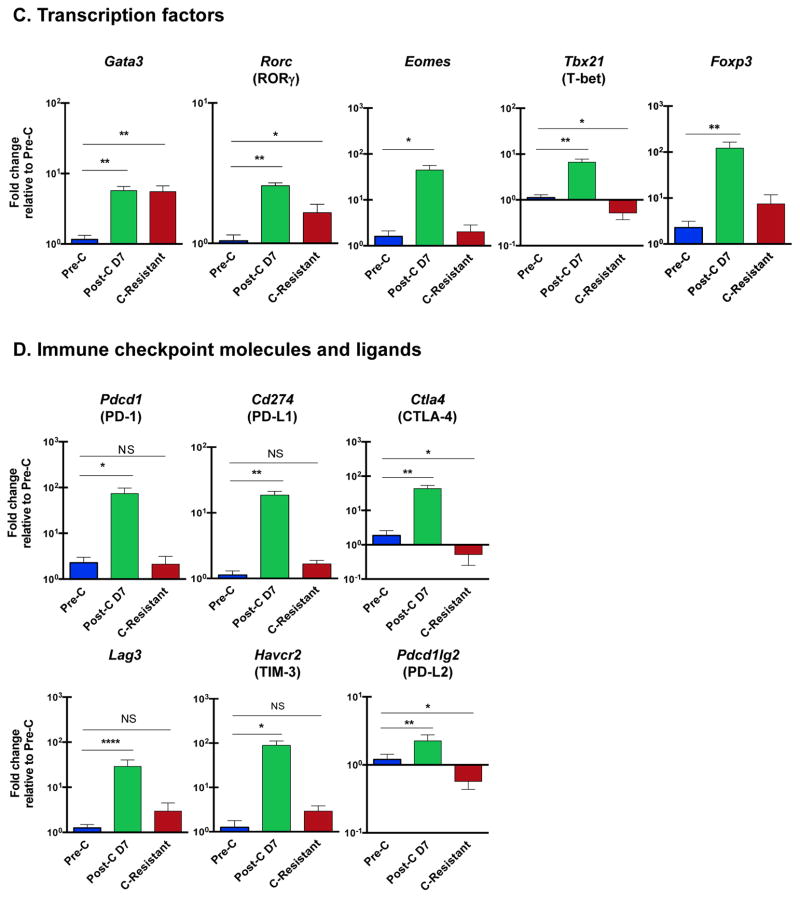
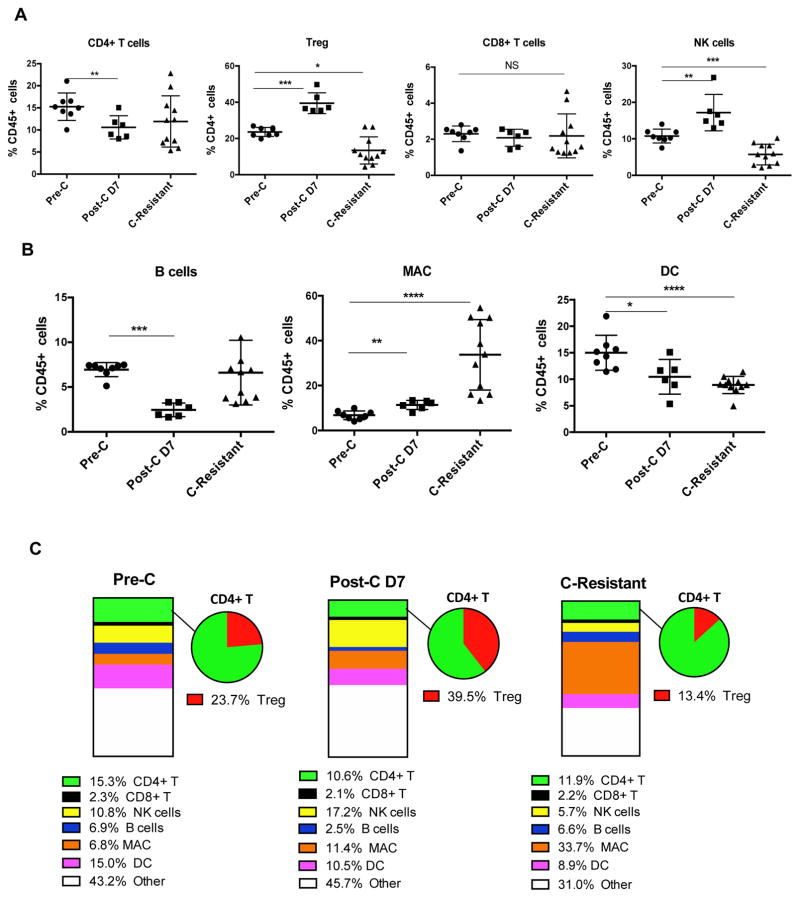
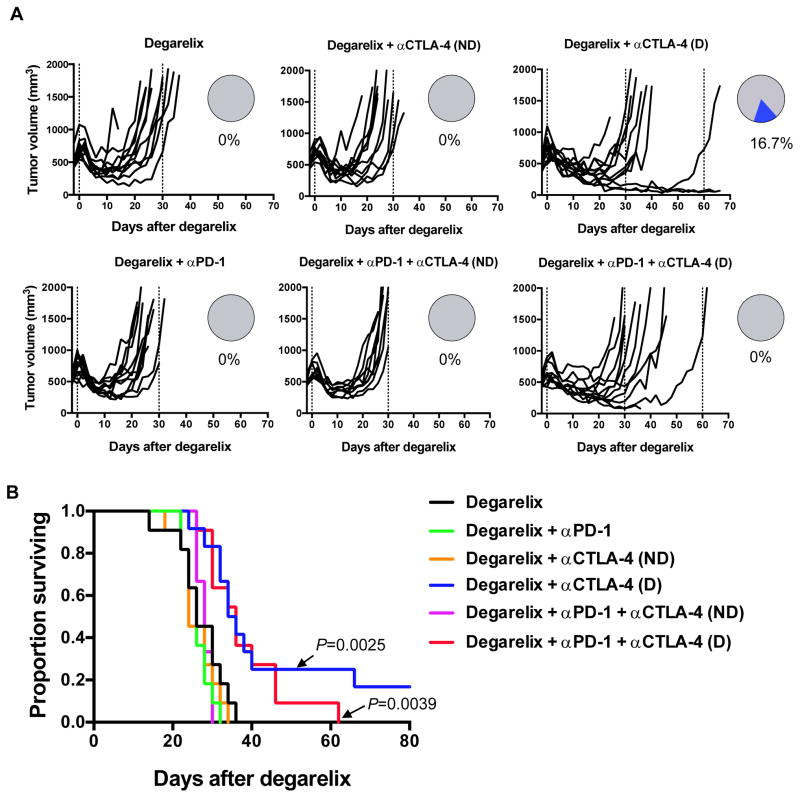
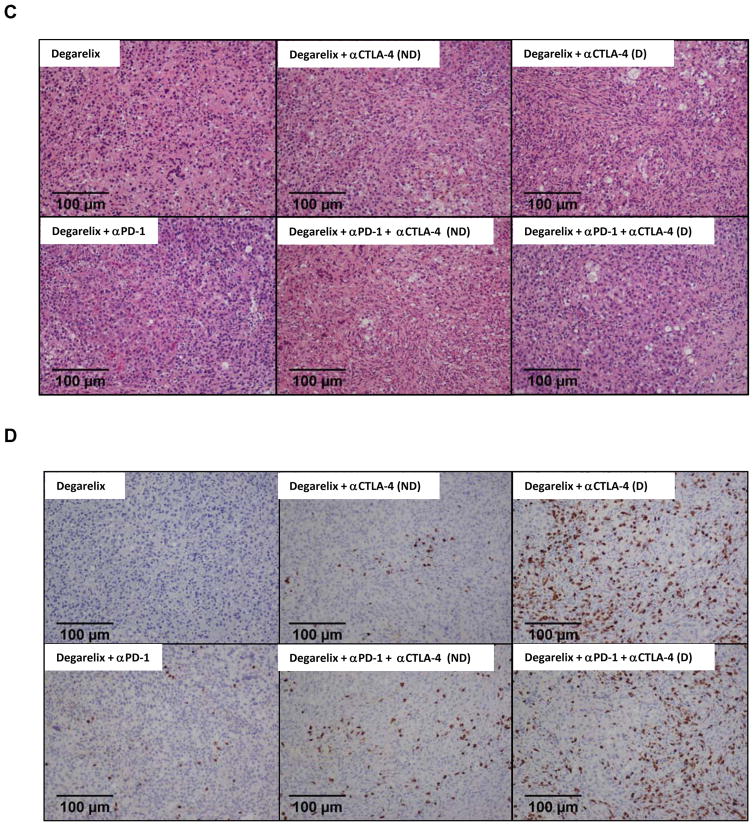
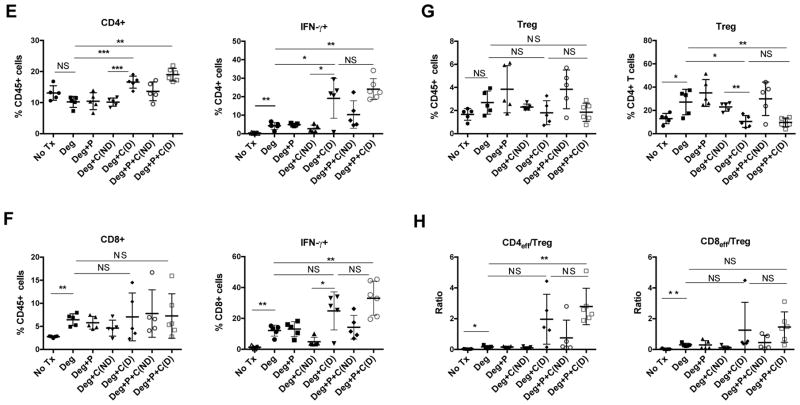
Methods: Using flow cytometry, qPCR and IHC, we quantified ADT-induced immune infiltration in terms of cell type and function. Preclinical treatment studies tested the combinatorial effects of ADT and immune checkpoint blockade using tumor outgrowth and overall survival as end points.

Results: ADT induces a complex pro-inflammatory infiltrate. This pro-inflammatory infiltrate was apparent in the early postcastration period but diminished as castration resistance emerged. Combining ADT with tumor-infiltrating regulatory T cell (Treg) depletion using a depleting anti-CTLA-4 antibody significantly delayed the development of castration resistance and prolonged survival of a fraction of tumor-bearing mice. Immunotherapy as a monotherapy failed to provide a survival benefit and was ineffective if not administered in the peri-castration period.

Conclusions: The immune infiltrate induced by ADT is diverse and varies over time. Therapeutic strategies focusing on depleting Tregs in the peri-castration period are of particular interest.


Conflict of interest statement

Conflicts of Interest: CGD has served as a paid consultant to Agenus, Bristol Myers Squibb, Compugen, Dendreon, Merck and Roche Genentech, and has received sponsored research funding (institutional) from Bristol Myers Squibb under the International Immuno-Oncology Network (IIoN).

Figures

Figure 1
Figure 1. Castration Resistance and Inflammation in the Myc-CaP Model
Eight-week old male FVB/NJ mice were inoculated with 1 × 10⁶ cells Myc-CaP cells in the right flank; when mean tumor volume reached 420 mm3, mice were randomly to treatment groups as shown (n=8 per group, repeated × 3). (A) Tumor growth curves - representative of at least 3 independent experiments. Vertical dashed line indicates time at which castration or control treatment was performed. (B) qPCR for selected androgen-associated transcripts; all data normalized to the pre-castration (Pre-C) group. Fold change calculated by ΔΔCt, normalized to pre-castration counts (Pre-C). Reactions performed in triplicate, repeated × 2. (C) Representative H&E sections of indicated tumors, magnification as shown. Data are mean ± SEM. P-values determined by unpaired t test or Mann-Whitney test. *, P <0.05; **, P <0.01; NS, not statistically significant.
Figure 2
Figure 2. Transcript-Level Evaluation of the Immune Components of the Post-Castration Tumor Microenvironment (TME)
Bulk tumor samples from animals treated as in Figure 1 analyzed by qPCR using indicated probe sets. Fold change calculated by ΔΔCt, normalized to Pre-C. Reactions performed in triplicate, repeated × 2. (A) Transcripts associated with immune cell subsets (B) Cytokines (C) Immunologically relevant transcription factors (D) Immune checkpoints and ligands Data are mean ± SEM. P-values determined by unpaired t test, *, P <0.05; **, P <0.01; NS, not statistically significant.
Figure 3
Figure 3. Flow Cytometry (Protein-Level) Quantification of the Cellular Immune Components of the Post-Castration Tumor Microenvironment (TME)
Single cell suspensions of resected tumors before castration (Pre-C), day 7 post castration (Post-C D7), and upon development of castration resistance (C-Resistant) analyzed by flow cytometry. Data are representative of at least 3 independent experiments, with 5–8 animals per group. (A) T cell populations as a percentage of CD45+ cells in the TME. Note that Treg are shown as a percentage of CD45+ / CD4+ cells for clarity. (B) Additional populations of interest, note that here macrophages (MAC) are defined as CD45 cells that are CD11b+ F4/80+. C) Summary data with Treg as a percentage of CD4 expanded for clarity. *, P<0.05; **, P<0.01; **, P<0.001; and ****, P<0.0001; NS, not statistically significant.
Figure 4
Figure 4. Expression of Effector Cytokines and Immune Checkpoint Molecules in the Post-Castration TME
Single cell suspensions of resected tumors before castration (Pre-C), day 7 post castration (Post-C D7), and upon development of castration resistance (C-Resistant). For cytokine analyses, cells were stimulated ex vivo with PMA and ionomycin for 4 hours and expression quantified by flow cytometry. Data are representative of at least 3 independent experiments with 5–8 animals per group (A) Cytokine expression on tumor infiltrating T cells. (B) Expression of immune checkpoint molecules on tumor infiltrating T cells as assessed by flow cytometry, note these samples were not stimulated prior to staining. Data are representative of two independent experiments, and are shown as mean ± SD. GrzB, granzyme B; *, P<0.05; **, P<0.01; ***, P<0.001; NS, not statistically significant.
Figure 5
Figure 5. Combining αCTLA-4(D) with ADT Prolongs Survival
Eight week-old FVB/NJ male mice were subcutaneously inoculated with 1 × 10⁶ Myc-Cap cells, and treated as indicated. N=10 animals per group, repeated × 1. (A) Individual tumor growth. Pie chart shows the proportion of complete responses (blue). (B) Overall survival from time of ADT. P values determined by Log-rank (Mantel-Cox) test in comparison with degarelix alone. (C). Representative H&E sections from treatment groups as indicated. Magnification × 20. (D) Representative IHC images of from anti-CD3 stained tumors. Magnification × 20. (E,F) Cytokine production by infiltrating CD4 and CD8 T cells respectively (G) Treg percentages as a percentage of total CD45 TIL and CD4 TIL respectively. (H) CD4 and CD8 effector to Treg ratios, effector defined as IFN-γ+ Data shown as mean ± SD. *, P<0.05; **, P<0.01; ***, P<0.001; NS, not statistically significant.

References

    1. Topalian SL, Drake CG, Pardoll DM. Immune checkpoint blockade: a common denominator approach to cancer therapy. Cancer Cell. 2015;27(4):450–61. - PMC - PubMed
    1. Callahan MK, Postow MA, Wolchok JD. Targeting T Cell Co-receptors for Cancer Therapy. Immunity. 2016;44(5):1069–78. - PubMed
    1. Slovin SF, Higano CS, Hamid O, Tejwani S, Harzstark A, Alumkal JJ, et al. Ipilimumab alone or in combination with radiotherapy in metastatic castration-resistant prostate cancer: results from an open-label, multicenter phase I/II study. Ann Oncol. 2013 - PMC - PubMed
    1. Kwon ED, Drake CG, Scher HI, Fizazi K, Bossi A, van den Eertwegh AJ, et al. Ipilimumab versus placebo after radiotherapy in patients with metastatic castration-resistant prostate cancer that had progressed after docetaxel chemotherapy (CA184-043): a multicentre, randomised, double-blind, phase 3 trial. Lancet Oncol. 2014;15(7):700–12. - PMC - PubMed
    1. Beer TM, Kwon ED, Drake CG, Fizazi K, Logothetis C, Gravis G, et al. Randomized, Double-Blind, Phase III Trial of Ipilimumab Versus Placebo in Asymptomatic or Minimally Symptomatic Patients With Metastatic Chemotherapy-Naive Castration-Resistant Prostate Cancer. J Clin Oncol. 2017;35(1):40–7. - PubMed

Publication types

MeSH terms