. 2018 Jan;21(1):139-149.
doi: 10.1038/s41593-017-0027-7. Epub 2017 Dec 4.

An interactive framework for whole-brain maps at cellular resolution

Affiliations

An interactive framework for whole-brain maps at cellular resolution

Daniel Fürth et al. Nat Neurosci. 2018 Jan.

Erratum in

Abstract

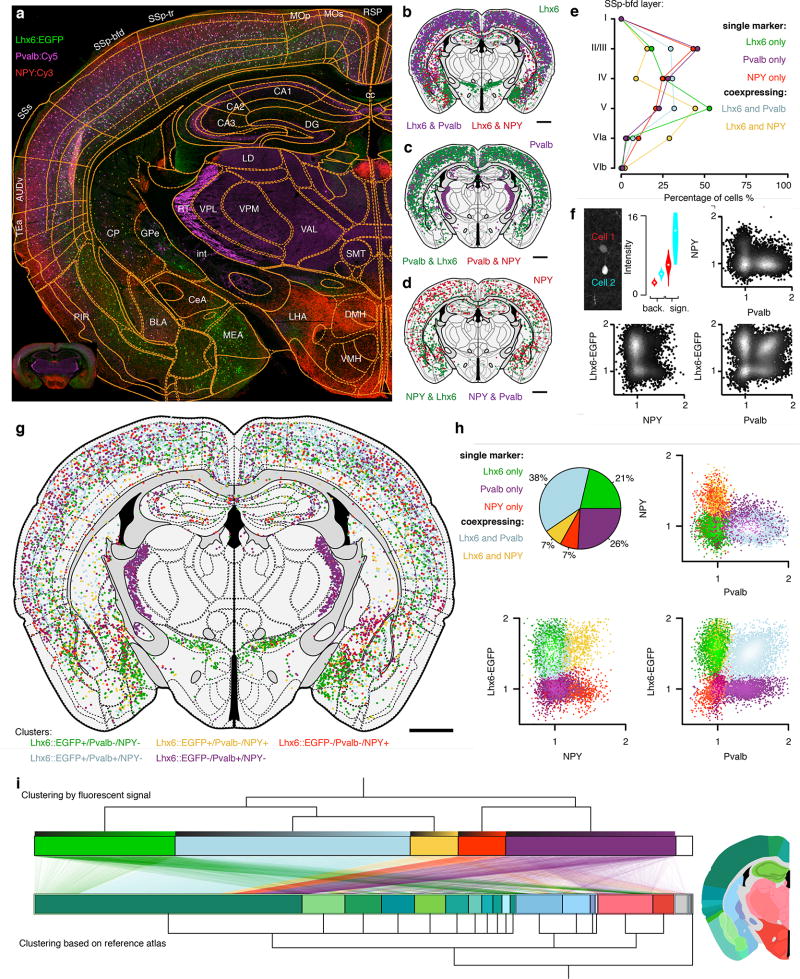
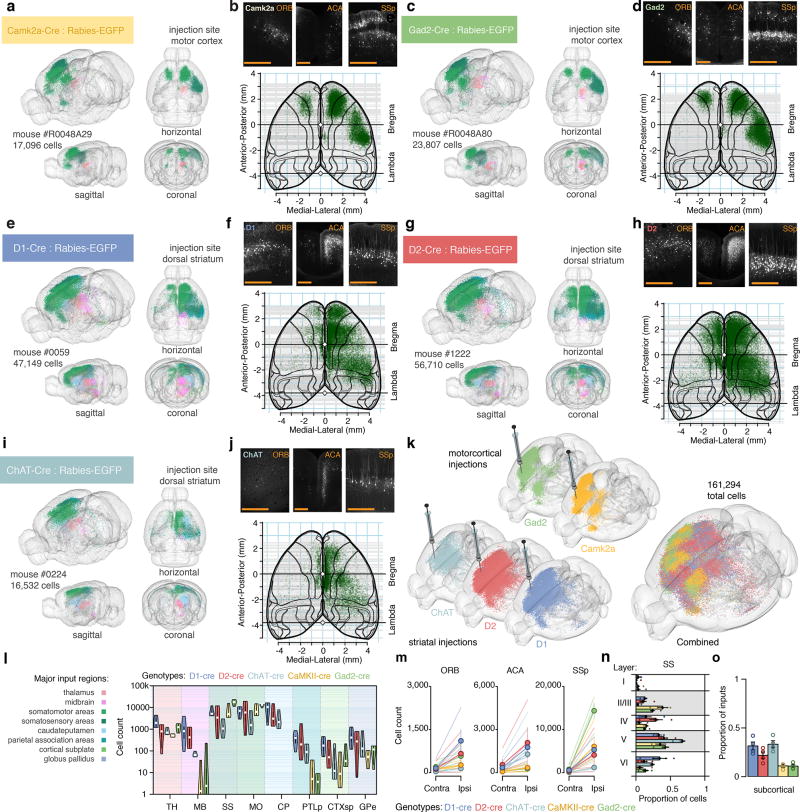
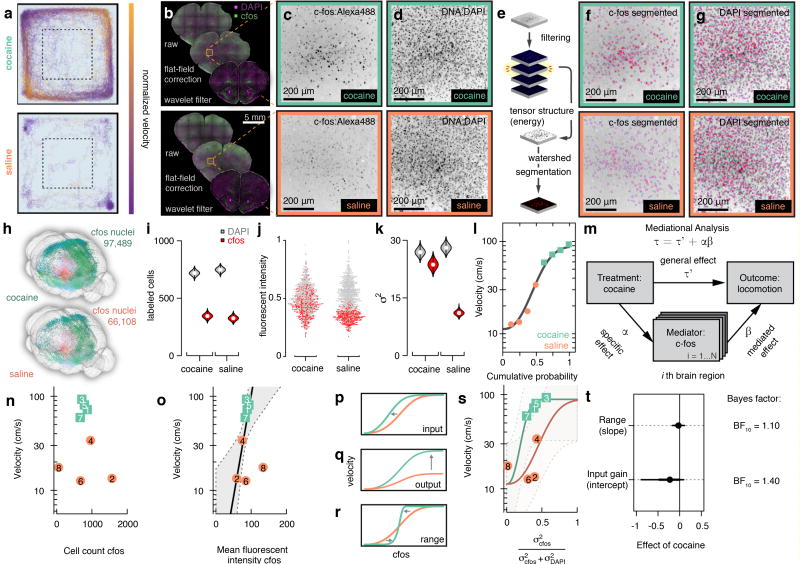
To deconstruct the architecture and function of brain circuits, it is necessary to generate maps of neuronal connectivity and activity on a whole-brain scale. New methods now enable large-scale mapping of the mouse brain at cellular and subcellular resolution. We developed a framework to automatically annotate, analyze, visualize and easily share whole-brain data at cellular resolution, based on a scale-invariant, interactive mouse brain atlas. This framework enables connectivity and mapping projects in individual laboratories and across imaging platforms, as well as multiplexed quantitative information on the molecular identity of single neurons. As a proof of concept, we generated a comparative connectivity map of five major neuron types in the corticostriatal circuit, as well as an activity-based map to identify hubs mediating the behavioral effects of cocaine. Thus, this computational framework provides the necessary tools to generate brain maps that integrate data from connectivity, neuron identity and function.


Conflict of interest statement

Competing financial interests

D.F. is a stakeholder in Histohub AB. The other authors declare no competing financial interests.

Figures

Figure 1
Figure 1. A reference atlas based on vector graphics
In cartography an object (a) is usually represented either in raster format (b) or vector format (c). Similarly, brain tissue (d) can be represented as raster images (e) or composed of geometric points and curves in a vector format (f). (g) Brain regions defined by polygons (green) are non-scalable compared to regions obtained from Non-Uniform Rational B-splines, NURBS, (purple). In 3D reference atlases can be defined based on different geometrical primitives; (h) voxels can be reduced to primitive solids such as cubes, (i), polygon surfaces provide a more compact representation of the surface only, and (j) NURBS provide a representation of the surface based on smooth B-splines where intersections in the form of curves can be computed to an arbitrary cutting plane.
Figure 2
Figure 2. A framework for standardizing and sharing neuroanatomical data
(a) Coronal section from D1-Cre mouse with rabies tracing targeted to the dorsal striatum, right hemisphere, green: rabies-EGFP, gray: bright-field. (b) Registration of atlas regions as well as segmentation of 1108 individual cell bodies, color coded according to region, light blue: striatum (STR), green: cortex (CTX). (c) Segmented rabies-EGFP labeled processes. (d) Quantification of segmented cell bodies. (e) Quantification of segmented processes. (f) Web-based vector representation of results registered to reference atlas. Scale bars: 500 µm (g) Interactive web-based annotation and navigation tools.
Figure 3
Figure 3. Method for segmentation and registration
(a) Wavelet multiresolution decomposition. (b) Original image tile. (c) Detail coefficients d1 at a scale period of 1.28 µm. (d) Coefficients at d3 with scale period 10.24 µm. (e) Coefficients at d5 with scale period 40.96 µm. (f) Approximation coefficients. (g) Top: original 16-bit image tile. Bottom: segmented processes with their direction color-coded by hue as well as cell bodies as white circles. Scale bar: 500 µm (h) Top: segmentation result separated into cell bodies. Bottom: segmented process. (i) Comparison of binary segmentation on different detail coefficients to a human annotator (n = 273 cell bodies), red: cell bodies, blue: processes, gray horizontal line: SNR of 1:1, green dashed line: Rose criteria SNR 5:1 [33]. Error bars: 95% confidence intervals around the mean. (j) Image section of rabies-EGFP targeted to dorsal striatum in D2-Cre mouse, purple lines: transformed reference atlas, light blue grid: backward warp transform from atlas to original image. (k) Segmentation of brains section based on autofluorescence (vertical purple line). Pink shaded area indicates range of fluorescent intensity where cell bodies can be found. (l) Correspondence generation by principal components, red dots: intersection with contour, white dots: midpoints. (m) 32 correspondence points between original contour, gray, and reference atlas, red. (n) Forward warp transform, light blue, of segmentation output into stereotactic space.
Figure 4
Figure 4. Compatibility of the framework with different imaging systems
(a) Compatibility of the framework with different imaging systems, including widefield, confocal, and light-sheet fluorescent microscopy. Raw fluorescent images of rabies EGFP for (b) widefield (c) confocal, and (d) light-sheet microscopes. Segmentation result of both cell bodies (white circles) and processes (color coded according to angle) for (e) widefield (f) confocal, and (g) light-sheet images in (b–c). (h) Cortical neurons from a volume imaged with light-sheet microscopy in a Thy1-eYFP mouse. (i) Segmentation algorithm applied across z-stacks (2.5D filter). (j) Cell bodies individually segmented from fluorescent signal attributed to processes and fiber tracts.
Figure 5
Figure 5. Mapping of molecular identity and neuron types
(a) Section of a Lhx6::EGFP transgenic mouse (green) stained for parvalbumin (magenta, PVALB::Cy5) and neuropeptide Y (NPY::Cy3). (b) Segmented Lhx6::EGFP positive cells and their co-expression with either PVALB (magenta) or NPY (red), green denotes Lhx6::EGFP neurons negative for both NPY and PVALB. (c) PVALB::Cy5 positive cells and their co-expression with either Lhx6::EGFP (green) or NPY (red), no co-expression between PVALB and NPY. (d) NPY::Cy3 positive cells (red) and co-expression with Lhx6::EGFP (green). (e) Laminar distribution of cell types in primary somatosensory cortex barrel field (SSp-bfd). (f) Definition of molecular signal at the single cell level (background, "back.", n = 400 pixels, signal, "sign.", n = 16 pixels). (g) 9021 segmented cell bodies registered to 116 unique regions in the reference atlas and clustered into five discrete classes based on fluorescent intensity alone. (h) Clustering of cells based on fluorescent intensity alone into five discrete populations (green: Lhx6-EGFP+ only, magenta: PVALB+ only, red: NPY+ only, yellow: NPY+/Lhx6-EGFP+ co-expressing, light blue: PVALB+/Lhx6-EGFP+ co-expressing). Pie chart illustrates percentage overlap. (i) Clustering based on marker identity (top) compared to clustering based on neuroanatomical location for each cell (bottom). Lines represent single neurons mapping between the two types of clustering (molecular identity versus anatomical). Neurons are sorted in ascending order according to their relative fluorescent intensity in each cluster (top gradient on each cluster). Anatomical color-coding is shown in the representative section, −1.5 mm from bregma (scale bar: 1 mm).
Figure 6
Figure 6. Retrograde monosynaptic tracing of corticostriatal networks
(a) Reconstruction of inputs to Camk2a neurons in motor cortex by targeted injection of glycoprotein-deleted EGFP expressing EnvA pseudotyped rabies virus, SADΔG-EGFP(EnvA). EGFP labeled neurons are color-coded based on anatomical location, see (l). (b) Cortical input to Camk2a neurons in motor cortex in orbital cortex (ORB), anterior cingulate area (ACA) and primary somatosensory area, SSp. Bottom: cortical overview of inputs from cortical cells roughly above −2.25 mm dorsoventral from the midline cortical surface.(c,d) Same as (a,b) but for Gad2 neurons in motor cortex. (e, f) D1+ medium spiny neurons in dorsal striatum. (g, h) D2+ medium spiny neurons in dorsal striatum. (i, j) Cholinergic interneurons in dorsal striatum.(k) llustration of rabies-EGFP labeling in individual brains (from five different transgenic Cre-lines) used for cell-type specific input comparisons. The brain in the very front is a composite where all neurons are combined (n = 161,294 neurons across five mice). (l) Violin plot of monosynaptic inputs from major input regions (n = 4 mice for each genotype). (m) Laterality of cortical inputs in specific regions (ORB, ACA, SSp). (n) Layer-specificity of monosynaptic inputs from SSp. Colors as in (l). (o) Proportion of inputs from subcortical regions. Circles show individual mice. Colors as in (l). Error bars: +/− one standard error of measurement. Scale bars: 500 µm.
Figure 7
Figure 7. Decoding motor behavior by immediate early gene activity
(a) Behavioural track tracing from open-field test in two mice injected with either cocaine or saline. (b) Coronal sections from the same mice showing the major steps of preprocessing before segmentation. (c) Close up on orbital cortex (ORB) and c-fos:Alexa488 staining. (d) Same field of view but DAPI. (e) Postfiltering segmentation steps include computing tensor structure and performing watershed-based segmentation. (f) Segmentation result, red, overlaid on images of c-fos, and (g) DAPI. (h) Whole-brain 3D reconstruction of same mice as in a–j. (i) Violin plot of cell count estimates obtained from ORB as shown in f–g, white circle marks median. (j) Normalized fluorescent intensity for 2135 individual nuclei in ORB. (k) Violin plot of variance σ2 estimates of fluorescent intensity in ORB, white circle marks median. (l) Cumulative distribution of locomotor velocity in open field across eight mice, gray line best fit four-parametric Weibull. (m) Meditational regression analysis for c-fos whole-brain data. (n) Velocity in open-field test as a function of cell count of c-fos positive nuclei of the orbital cortex in saline (coral) and cocaine (turquoise) treated mice, numbers indicate animal identification number. (o) Velocity as function of mean fluorescent c-fos intensity, thick gray line indicates regression line when autofluorescence is added as a covariate, gray area; 80% CI. (p) Gain control by input gain. (q) Output gain, or (r) Range compression. (s) Velocity as a function of DAPI standardized c-fos variance. (t) Posterior estimates of the effect of cocaine on slope and intercept, error bars 70% (thick) and 80% (thin) CI. n = 4 mice per group (cocaine, saline).

References

    1. Alivisatos AP, et al. The brain activity map project and the challenge of functional connectomics. Neuron. 2012;74:970–974. - PMC - PubMed
    1. Mitra PP. The circuit architecture of whole brains at the mesoscopic Scale. Neuron. 2014;83:1273–1283. - PMC - PubMed
    1. Denk W, Briggman KL, Helmstaedter M. Structural neurobiology: missing link to a mechanistic understanding of neural computation. Nat. Rev. Neurosci. 2012;13:351–358. - PubMed
    1. Bohland JW, et al. A proposal for a coordinated effort for the determination of brainwide neuroanatomical connectivity in model organisms at a mesoscopic scale. PLoS Comput Biol. 2009;5 - PMC - PubMed
    1. Oh SW, et al. A mesoscale connectome of the mouse brain. Nature. 2014;508:207–214. - PMC - PubMed

Publication types

MeSH terms