. 2018 Jan;50(1):83-95.
doi: 10.1038/s41588-017-0002-y. Epub 2017 Dec 4.

TET proteins safeguard bivalent promoters from de novo methylation in human embryonic stem cells

Affiliations

TET proteins safeguard bivalent promoters from de novo methylation in human embryonic stem cells

Nipun Verma et al. Nat Genet. 2018 Jan.

Erratum in

Abstract

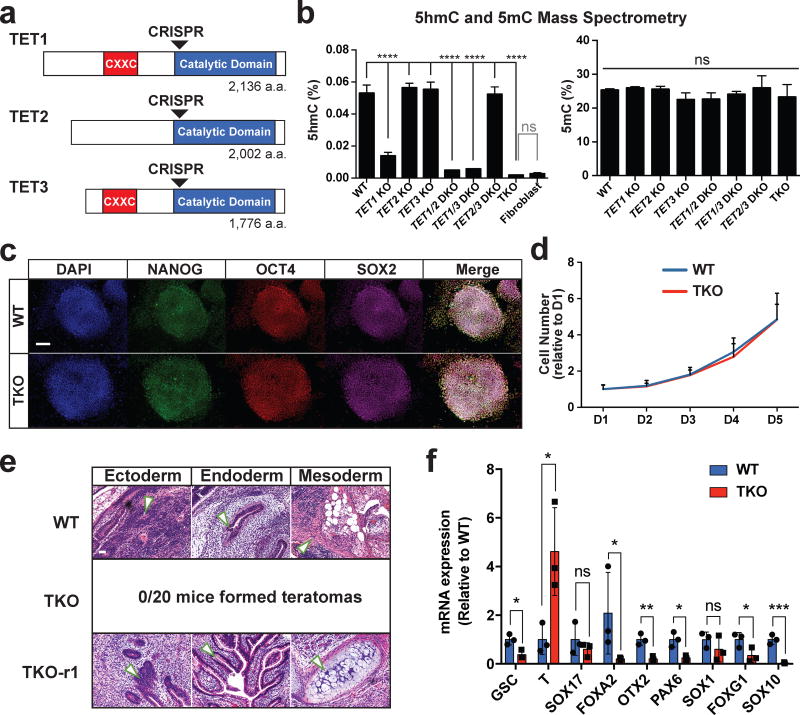
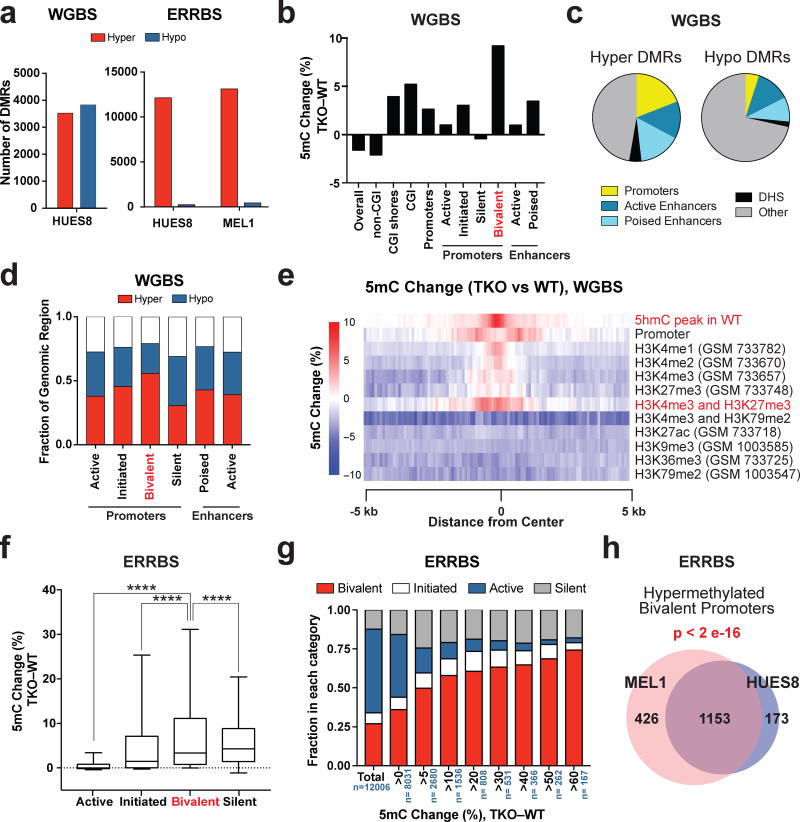
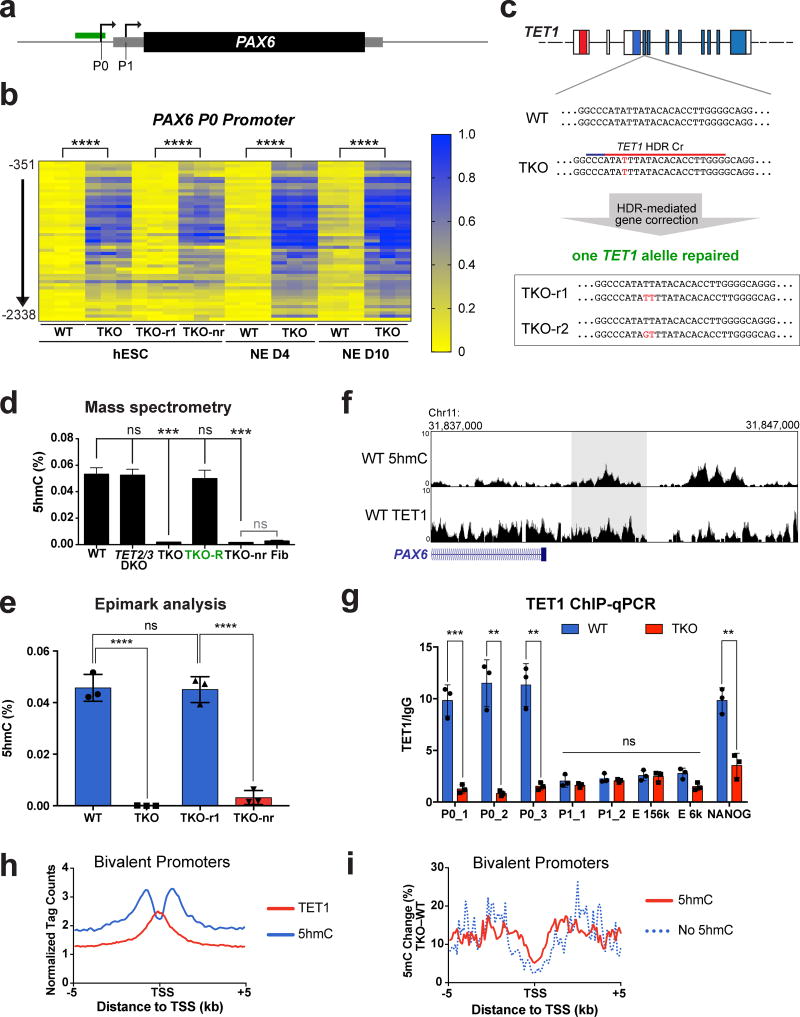
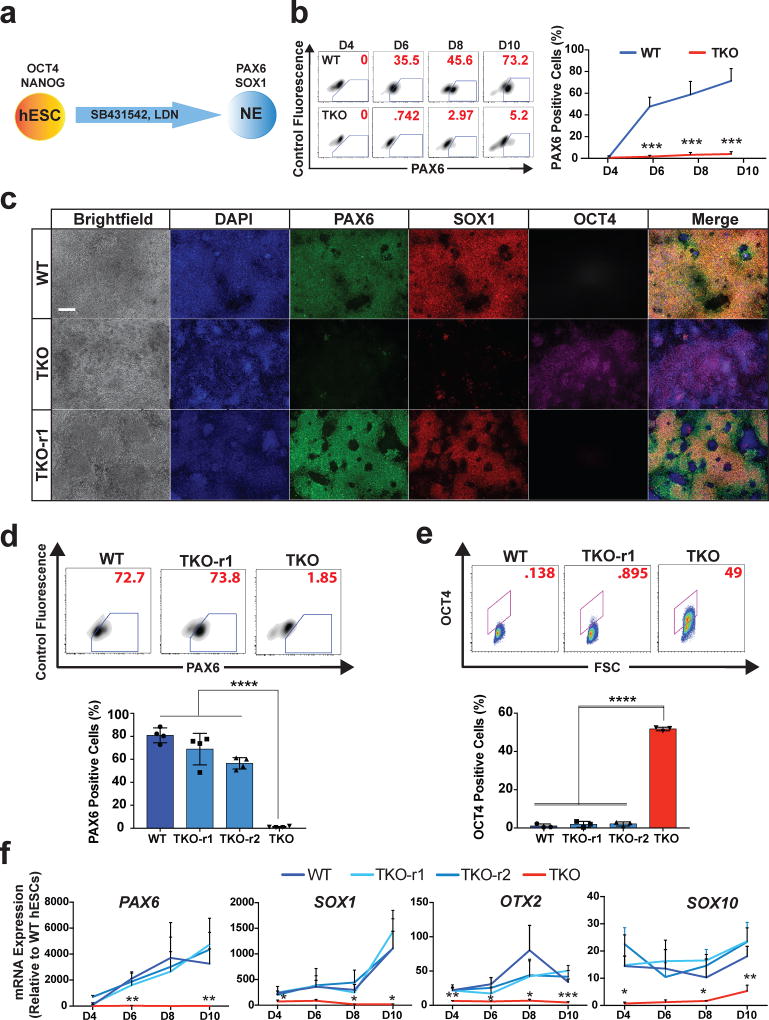
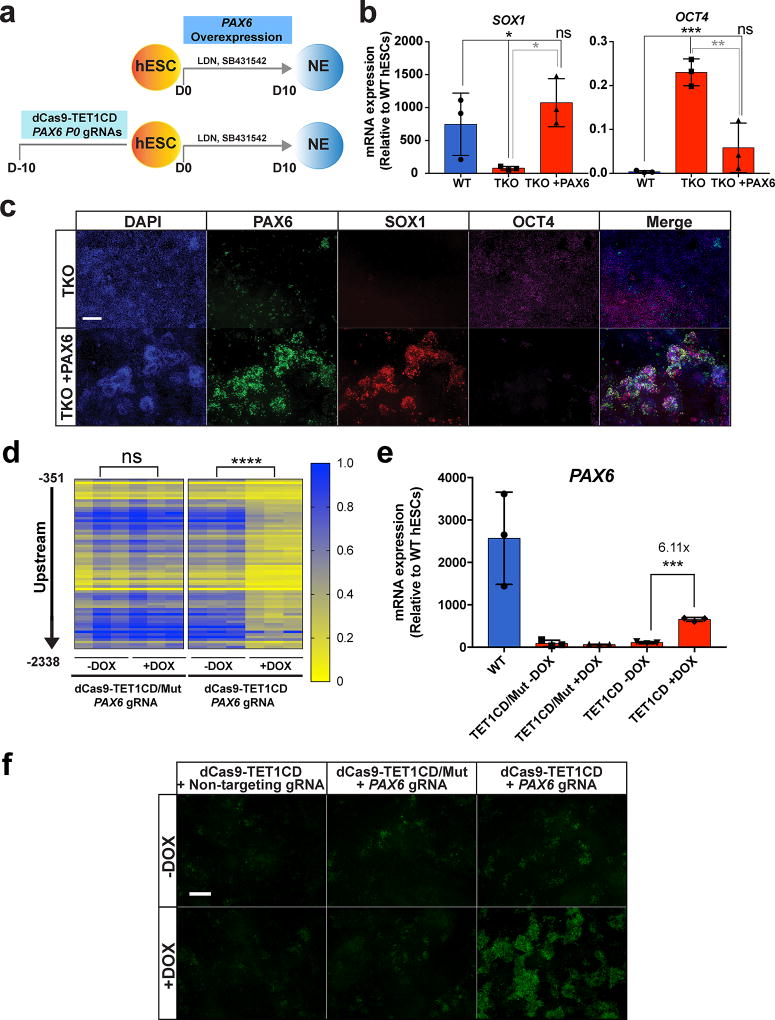
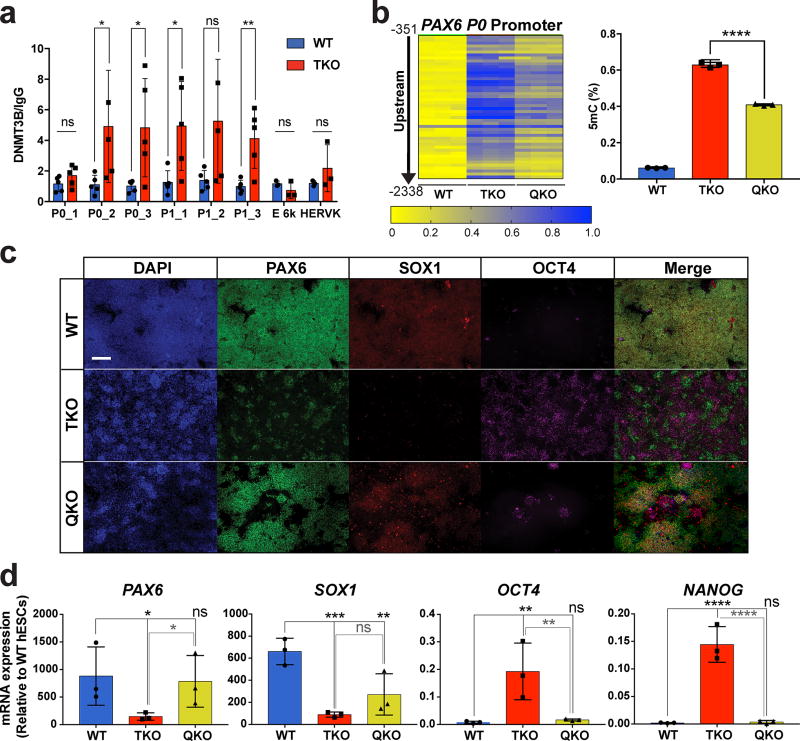
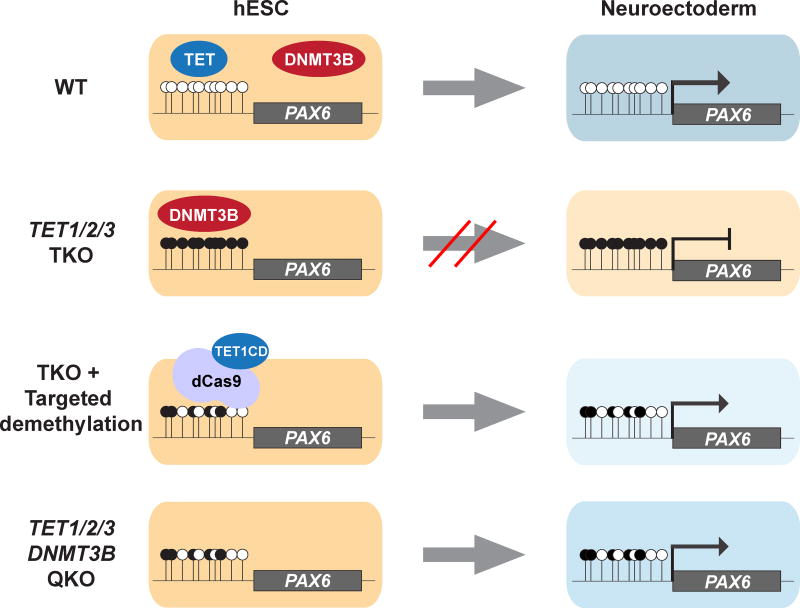
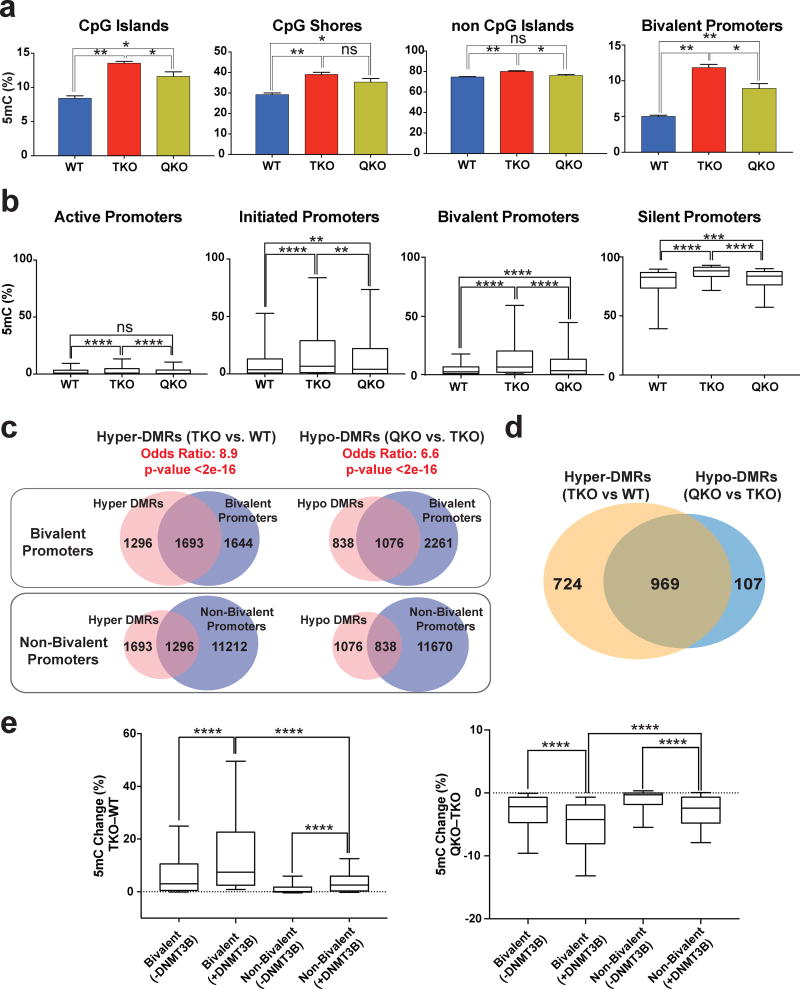
TET enzymes oxidize 5-methylcytosine (5mC) to 5-hydroxymethylcytosine (5hmC), which can lead to DNA demethylation. However, direct connections between TET-mediated DNA demethylation and transcriptional output are difficult to establish owing to challenges in distinguishing global versus locus-specific effects. Here we show that TET1, TET2 and TET3 triple-knockout (TKO) human embryonic stem cells (hESCs) exhibit prominent bivalent promoter hypermethylation without an overall corresponding decrease in gene expression in the undifferentiated state. Focusing on the bivalent PAX6 locus, we find that increased DNMT3B binding is associated with promoter hypermethylation, which precipitates a neural differentiation defect and failure of PAX6 induction during differentiation. dCas9-mediated locus-specific demethylation and global inactivation of DNMT3B in TKO hESCs partially reverses the hypermethylation at the PAX6 promoter and improves differentiation to neuroectoderm. Taking these findings together with further genome-wide methylation and TET1 and DNMT3B ChIP-seq analyses, we conclude that TET proteins safeguard bivalent promoters from de novo methylation to ensure robust lineage-specific transcription upon differentiation.


Conflict of interest statement

Competing financial interests

5hmC-Seal has been licensed to Active Motif and Epican by the University of Chicago.

Figures

Figure 1
Figure 1. TET TKO hESCs exhibit differentiation defects
a, TET knockout mutants were generated using CRISPR gRNAs (arrowheads) that target the beginning of the catalytic domain of TET1, TET2 and TET3. b, Analysis of 5hmC (left) and 5mC (right) in HUES8 WT and TET knockout hESCs by mass spectrometry. For all mass spectrometry analysis, 2 mutant lines were used for all KO genotypes except for TKO. For TKO lines, 2 different passages of the same line were used for mass spectrometry measurements. Human fibroblasts were used as a negative control for mass spectrometry of 5hmC. Data presented are mean ± STD. Statistical analysis: black lines indicate comparisons to WT, one-way ANOVA, ****P<0.0001. c, Pluripotency markers NANOG, OCT4 and SOX2, were detected by immunofluorescence. Scale bar indicates 100 µm. d, Growth curves for WT and TKO hESCs, n= 3 independent experiments. Data presented are mean ± STD. e, Hematoxylin and eosin staining of teratoma sections from WT teratomas. Arrows point to representative tissues for the respective germ layers. No teratomas were obtained 6 months after injection of TKO hESCs. f, Expression for markers of mesoderm (GSC T), endoderm (SOX17 FOXA2), neuroectoderm (OTX2 PAX6 SOX1 FOXG1) and neural crest (SOX10) at D12 of spontaneous embryoid body differentiation, n= 3 independent experiments. Data presented are mean ± STD. Statistical analysis: Student’s t test (two sided), *P<0.05,**P<0.01,***P<0.001.
Figure 2
Figure 2. Hypermethylation of bivalent promoters in TET TKO hESCs
a, Total number of hyper-DMRs (TKO vs. WT) for HUES8 and MEL1 TKO lines compared to HUES8 and MEL1 WT lines by whole genome bisulfite sequencing (WGBS, left) and enhanced reduced representation bisulfite sequencing (ERRBS, right). b, Average percent DNA methylation change between HUES8 TKO and WT hESCs by WGBS at different genomic regions. The definitions for the different genomic regions can be found in the Methods section. c, Enrichment of various regulatory regions in hyper and hypo-DMRs by WGBS. (DHS) DNase I Hypersensitive sites. The definitions for the different genomic regions can be found in the Methods section. d, Fraction of genomic regions that show >5% increase in 5mC (Hyper) or a >5% decrease in 5mC (Hypo) in methylation between TKO and WT hESCs by WGBS of HUES8 WT and TKO hESCs. e,, Heat map of the average 5mC level differences between HUES8 TKO and WT hESCs at the center of the annotated histone modifications by WGBS. f, DNA methylation change between HUES8 TKO and WT hESCs by ERRBS at different promoter types. Box and whisker plots were generated using the methylation change at individual promoters. The error bars show 10 and 90 percent confidence intervals and the bar at the center of the box and whisker plot indicates the median. The promoters are divided into four groups based on histone modification patterns. The details of promoter definitions can be found in the Methods section, n= 2 independent experiments. Statistical analysis: one-way ANOVA, ****P<0.0001. g, Representation of active, initiated, bivalent and silent promoters among promoters that show different degrees of methylation change between HUES8 TKO and HUES8 WT hESCs by ERRBS, n indicates the total number of promoters in each DNA methylation change group, n= 2 independent experiments. h, Overlap of the bivalent promoters that show greater than 5% methylation increase in HUES8 and MEL1 TKO lines compared to HUES8 and MEL1 WT lines by ERRBS. The p-value for the overlap between HUES8 and MEL1 hypermethylation at bivalent promoters is given (Fisher’s exact test). WGBS: n = 1 independent experiment, ERRBS: n = 2 independent experiments (2 independent experiments for HUES8 WT and HUES8 TKO, 2 independent experiments for MEL1 WT and MEL1 TKO).
Figure 3
Figure 3. TKO hESCs show hypermethylation at the PAX6 P0 bivalent promoter
a, Schematic for analysis of 5mC, 5hmC and TET1 binding at the PAX6 locus. Arrows represent the P0 and P1 promoter, the grey box represents the PAX6 mRNA transcript and the black box represents the PAX6 protein. The region analyzed for 5mC using MassArray and for 5hmC using hMe-Seal profiling is shown by a green box. b, Heat map of MassArray analysis of 5mC at the PAX6 P0 promoter. The location of each row of CpGs with respect to the P0 TSS is shown to the left of the heat map. For each cell line three independent experiments are shown as three columns. (NE D4) Neuroectoderm differentiation day 4; (NE D10) Neuroectoderm Differentiation day 10. Statistical analysis: Student’s t test (two sided), ****P<0.0001. c, Diagram of homology-directed repair (HDR) of the TET1 locus in TKO hESCs. Red letters indicate mutations of the WT sequence. The sequences of the two repaired lines (TKO-r1, TKO-r2) are shown below. d, Mass spectrometry analysis of 5hmC levels in WT, TET KO mutant lines, lines in which one allele of TET1 has been repaired (TKO-R) and lines which underwent HDR targeting but retained the TKO mutations in the TET1 locus (TKO-nr). For all mass spectrometry analysis, 2 mutant lines were used for all genotypes except for TKO. For TKO lines, 2 different passages of the same line were used for mass spectrometry measurements. Data presented are mean ± STD. Statistical analysis: black lines indicate comparisons to WT, one-way ANOVA, ***P<0.001. e, Analysis of percent 5hmC at the PAX6 P0 promoter by Epimark, n= 3 independent experiments. Data presented are mean ± STD. Statistical analysis: Student’s t test (two sided), ****P<0.0001. f, Top panel: Analysis of 5hmC peak at the PAX6 P0 promoter by hMe-Seal in WT hESCs. Bottom panel: Analysis of TET1 peak at the PAX6 P0 promoter by TET1 ChIP-Seq in WT hESCs. Shaded area represents the region of the PAX6 P0 promoter assayed for 5hmC by Epimark (e) and TET1 binding by ChIP-qPCR (g). g, ChIP-qPCR for TET1 in WT and TKO hESCs, n= 3 independent experiments. Data presented are mean ± STD. Statistical analysis: Student’s t test (two sided), *P<0.05, **P<0.01, ***P<0.001. h, Analysis of 5hmC and TET1 peaks at bivalent promoters in WT hESCs. The height above the x-axis reflects the normalized tag count. i, Percent DNA methylation change (TKO – WT) in bivalent promoters that have 5hmC peaks compared to bivalent promoters that don’t have 5hmC peaks.
Figure 4
Figure 4. TKO hESCs show a defect in neuroectoderm differentiation
a, Schematic for neuroectoderm (NE) differentiation. b, Representative FACS plots of PAX6 staining at D4, D6, D8 and D10 of WT and TKO cells (left panel). On the right is the quantification of PAX6-positive cells at D4, D6, D8 and D10 of NE differentiation, n= 3 independent experiments. Data presented are mean ± STD. Statistical analysis: Student’s t test (two sided), ***P<0.001. c, Immunofluorescence of PAX6, SOX1 and OCT4 at the endpoint of differentiation (D10) of WT, TKO and TKO-r1 cells. Scale bar indicates 100 µm. d, Representative FACS plots (top) and quantification (bottom) of PAX6 staining at D10 of NE Differentiation, n= 3 independent experiments. Data presented are mean ± STD. Statistical analysis: one-way ANOVA, ****P<0.0001. e, Representative FACS plots (top) and quantification (bottom) of OCT4 staining at D10 of NE differentiation, n= 3 independent experiments. Data presented are mean ± STD. Statistical analysis: one-way ANOVA, ****P<0.0001. f, qPCR analysis for epiblast (OTX2), neuroectoderm (PAX6 SOX1 and OTX2) and neural crest (SOX10) markers during NE differentiation, n= 3 independent experiments. Data presented are mean ± STD. Statistical analysis: one-way ANOVA, *P<0.05, **P<0.01, ***P<0.001.
Figure 5
Figure 5. Hypermethylation of the PAX6 P0 bivalent promoter in TKO hESCs leads to a failure of PAX6 induction upon neuroectoderm differentiation
a, Schema for rescue of the NE differentiation defect in TKO hESCs using PAX6 overexpression or targeted demethylation of the PAX6 P0 promoter. b, qPCR analysis of neuroectoderm (SOX1) and pluripotency (OCT4) markers in WT and TKO cells without doxycycline (TKO) and with doxycycline treatment (TKO +PAX6) at D10 of NE differentiation, n= 3 independent experiments. Data presented are mean ± STD. Statistical analysis: one-way ANOVA, *P<0.05, **P<0.01, ***P<0.001. c, Immunofluorescence of PAX6, SOX1 and OCT4 at the endpoint of differentiation (D10) of TKO cells without doxycycline treatment (TKO) and with doxycycline treatment (TKO + PAX6). Scale bar indicates 100 µm. d, Heat map of MassArray analysis of 5mC at the PAX6 P0 promoter for TKO hESCs that express PAX6 targeting gRNAs with either a dCas9-TET1CD/Mut (left) or a dCas9-TET1CD (right) fusion protein. The location of each row of CpGs with respect to the P0 TSS is shown to the left of the heat map. Methylation analysis at the PAX6 P0 promoter was analyzed for these cell lines with and without doxycycline treatment, n= 3 independent experiments. Statistical analysis: Student’s t test (two sided), ****P<0.0001. e, qPCR of PAX6 expression on D10 of NE differentiation for TKO hESCs that express PAX6 targeting gRNAs with either a dCas9-TET1CD/Mut or a dCas9-TET1CD fusion protein. PAX6 expression was analyzed for these cell lines with and without doxycycline treatment prior to differentiation, n= 3 independent experiments. Data presented are mean ± STD. Statistical analysis: Student’s t test (two sided), ***P<0.001. f, Immunofluorescence of PAX6 on D10 of NE differentiation for TKO hESCs that express PAX6 targeting gRNAs with either a dCas9-TET1CD/Mut or a dCas9-TET1CD fusion protein. TKO hESCs expressing the dCas9-TET1CD fusion and a non-targeting gRNA were also used as a control. PAX6 immunofluorscence was analyzed for these cell lines with and without doxycycline treatment prior to differentiation. Scale bar indicates 100 µm.
Figure 6
Figure 6. Genetic inactivation of DNMT3B partially rescues the neuroectoderm differentiation defect of TKO hESCs
a, ChIP-qPCR for DNMT3B at the PAX6 locus in WT and TKO hESCs, n= 3 independent experiments. Data presented are mean ± STD. Statistical analysis: Student’s t test (two sided), *P<0.05, **P<0.01. b, Heat map of MassArray analysis of 5mC at the PAX6 P0 promoter in WT, TKO and QKO hESCs. WT and TKO hESCs are passage-matched with the QKO hESCs. The location of each row of CpGs with respect to the TSS is shown to the left of the heat map. For each cell line three independent experiments are shown as three columns. Quantification of the percent methylation is shown on the right, n= 3 independent experiments. Data presented are mean ± STD. Statistical analysis: Student’s t test (two sided), ****P<0.0001. c, Immunofluorescence of PAX6, SOX1 and OCT4 at D10 of NE differentiation in WT, TKO and QKO cells. Scale bar indicates 100 µm. d, qPCR analysis of neuroectoderm (PAX6 and SOX1) and pluripotency (OCT4 and NANOG) markers in WT, TKO and QKO cells at D10 of NE differentiation, n= 3 independent experiments. Data presented are mean ± STD. Statistical analysis: black lines indicate comparisons to WT, one-way ANOVA, *P<0.05,**P<0.01,***P<0.001, ****P<0.0001.
Figure 7
Figure 7. TET1 and DNMT3B compete to regulate the methylation of the PAX6 P0 bivalent promoter
In WT hESCs TET1 or 5hmC functions to antagonize DNMT3B at the PAX6 bivalent promoter and prevents DNA hypermethylation. Upon NE differentiation PAX6 expression is activated and leads to the production of PAX6 and SOX1 double positive cells that are negative for the pluripotency marker OCT4. In TKO hESCs increased DNMT3B binding at the PAX6 bivalent promoter leads to increased DNA methylation. As a result PAX6 expression is not activated and ultimately few PAX6 or SOX1-positive cells are produced and a large number of cells still express the pluripotency marker OCT4. Targeted demethylation of the PAX6 P0 bivalent promoter or inactivation of DNMT3B in the TKO background (QKO) reduces methylation at the PAX6 bivalent promoter, allowing activation of PAX6 expression upon differentiation.
Figure 8
Figure 8. DNMT3B regulates the methylation level at bivalent promoters
a, Average methylation at different genomic regions and bivalent promoters for WT, TKO and QKO hESCs by enhanced reduced representation bisulfite sequencing (ERRBS), n = 2 independent experiments. Data presented are mean ± STD. Statistical analysis: one-way ANOVA, *P<0.05,**P<0.01. b, Percent methylation in WT, TKO and QKO hESCs for active, initiated, bivalent and silent promoters. Error bars show 10 and 90 percent confidence intervals and the bar at the center of the box and whisker plot indicates the median, n = 2 independent experiments. Statistical analysis: one-way ANOVA, **P<0.01,***P<0.001, ****P<0.0001. c, Top: Overlap of bivalent promoters with hyper-DMRs at promoter regions (TKO vs. WT) and hypo-DMRs at promoter regions (QKO vs. TKO). Bottom: Overlap of non-bivalent promoters with hyper-DMRs at promoter regions (TKO vs. WT) and hypo-DMRs at promoter regions (QKO vs. TKO). The odd’s ratio and p-value for a comparison between bivalent and non-bivalent promoters is provided (Fisher’s exact test). d, The overlap between hyper-DMR (TKO vs. WT) associated bivalent promoters and hypo-DMR (QKO vs. TKO) associated bivalent promoters. e, Left: Methylation change (TKO – WT) for bivalent and non-bivalent promoters that either have DNMT3B peaks in TKO hESCs (+DNMT3B) or do not have DNMT3B peaks in TKO hESCs (−DNMT3B). Right: Methylation change (QKO – TKO) for bivalent and non-bivalent promoters that either have DNMT3B peaks in TKO hESCs (+DNMT3B) or do not have DNMT3B peaks in TKO hESCs (−DNMT3B). Error bars show 10 and 90 percent confidence intervals and the bar at the center of the box and whisker plot indicates the median, n = 2 independent experiments. Statistical analysis: one-way ANOVA, ****P<0.0001.

Similar articles

Cited by

References

    1. Ziller MJ, Gu H, Muller F, Donaghey J, Tsai LT, Kohlbacher O, De Jager PL, Rosen ED, Bennett DA, Bernstein BE, et al. Charting a dynamic DNA methylation landscape of the human genome. Nature. 2013;500:477–481. - PMC - PubMed
    1. Robertson KD. DNA methylation and human disease. Nature Reviews Genetics. 2005;6:597–610. - PubMed
    1. Li E, Bestor TH, Jaenisch R. Targeted mutation of the DNA methyltransferase gene results in embryonic lethality. Cell. 1992;69:915–926. - PubMed
    1. Okano M, Bell DW, Haber DA, Li E. DNA methyltransferases Dnmt3a and Dnmt3b are essential for de novo methylation and mammalian development. Cell. 1999;99:247–257. - PubMed
    1. Smith ZD, Meissner A. DNA methylation: roles in mammalian development. Nature Reviews Genetics. 2013;14:204–220. - PubMed

Publication types

MeSH terms