. 2017 Nov 17:8:839.
doi: 10.3389/fphys.2017.00839. eCollection 2017.

LETM1-Mediated K+ and Na+ Homeostasis Regulates Mitochondrial Ca2+ Efflux

Affiliations

LETM1-Mediated K+ and Na+ Homeostasis Regulates Mitochondrial Ca2+ Efflux

Shane Austin et al. Front Physiol. .

Abstract

Ca2+ transport across the inner membrane of mitochondria (IMM) is of major importance for their functions in bioenergetics, cell death and signaling. It is therefore tightly regulated. It has been recently proposed that LETM1—an IMM protein with a crucial role in mitochondrial K+/H+ exchange and volume homeostasis—also acts as a Ca2+/H+ exchanger. Here we show for the first time that lowering LETM1 gene expression by shRNA hampers mitochondrial K+/H+ and Na+/H+ exchange. Decreased exchange activity resulted in matrix K+ accumulation in these mitochondria. Furthermore, LETM1 depletion selectively decreased Na+/Ca2+ exchange mediated by NCLX, as observed in the presence of ruthenium red, a blocker of the Mitochondrial Ca2+ Uniporter (MCU). These data confirm a key role of LETM1 in monovalent cation homeostasis, and suggest that the effects of its modulation on mitochondrial transmembrane Ca2+ fluxes may reflect those on Na+/H+ exchange activity.

Keywords: LETM1; calcium; mitochondrial cation/proton exchange; mitochondrial volume homeostasis; potassium; sodium.


Figures
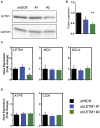
Figure 1
Figure 1
Mitochondrial Ca2+ modulators are unaffected by LETM1 expression. (A) Immunoblot of scrambled control (SCR) and LETM1 knockdown cells (#1, #2) for LETM1 and GAPDH as indicated. (B) Densiometric quantification of five independent immunoblots of samples as shown in (A). Data shown are mean LETM1 expression relative to loading control ± SEM (n = 5). **p < 0.01, one way ANOVA with Dunnett's multiple comparisons test. (C) Gene expression of (left to right as indicated): LETM1, MCU, NCLX (SLC8B1) in shSCR control and shLETM1 cells. All data are mean gene expression relative to TBP of n = 4–5 independent experiments ± SEM. *p < 0.05, one way ANOVA with Dunnett's multiple comparisons test. (D) Gene expression of mitochondrially encoded genes (left to right as indicated): ATP6, COXI, compared to a nucleus-encoded control (18S) in shSCR control and shLETM1 cells. All data are mean gene expression relative to TBP of n = 4 independent experiments ± SEM.
Figure 2
Figure 2
LETM1 expression regulates mitochondrial KHE. (A) Representative trace of KOAc induced swelling in shSCR (black circles) and shLETM1 (#1 blue squares, #2 green triangles) isolated mitochondria. The increase of matrix volume corresponds to the decrease of optical density, as indicated by the arrow. (B) Quantification of three independent swelling experiments as shown in (A). Control demonstrating inhibition of swelling with quinine (shSCR + Q- quantified on right axis) is the average of two independent experiments with 1 mM quinine in swelling buffer. Data are means ± SEM (n = 3). **p < 0.01, one way ANOVA with Dunnett's multiple comparisons test. (C) Representative trace of NaOAc induced swelling in shSCR (black circles) and shLETM1 (#1 blue squares, #2 green triangles) isolated mitochondria. (D) Quantification of four independent swelling experiments as shown in (C). Data are means ± SEM (n = 4). **p < 0.01, ***p < 0.005 one way ANOVA with Dunnett's multiple comparisons test.
Figure 3
Figure 3
LETM1 depletion results in K+ accumulation in the matrix. (A–C) Intact HeLa control cells expressing mtRFP (B) were loaded with mitoPOP (A), to demonstrate mitochondrial localization of the probe merged image (C). Confocal microscopy images are representative of cells in 2 independent experiments. Scale bar: 20 μm in all images. (D) Fluorescence intensity (normalized on K+-free medium) of the mitoPOP probe in response to different [K+]. Data are means ± SD (n = 3). (E) Fluorescence intensity (normalized on neutral pH) of the mitoPOP probe at different pH values. Data are means ± SD (n = 3). (F) Mitochondrial membrane potential of permeabilized HeLa control (shSCR) and LETM1 knockdown (shLETM1 #1, #2) cells. Data are means ± SD (n = 3). (G) Response curve obtained by addition of KCl as indicated to individual wells containing intact HeLa control cells loaded with mitoPOP indicator. Data are means ± SEM (n = 3). (H) Response curve obtained by addition of sucrose as indicated to individual wells containing intact HeLa control cells loaded with mitoPOP indicator. Data are means ± average deviation (n = 2) conducted in technical duplicates. (I) Normalized mitoPOP fluorescence intensity of intact HeLa control (shSCR) and LETM1 knockdown (shLETM1 #1, #2) cells. Fluorescence values were normalized to the cell number after measurement. Data are means ± SEM (n = 5). *p < 0.05, one way ANOVA with Dunnett's multiple comparisons test. (J) MitoPOP fluorescence intensity of intact HeLa control (shSCR) and LETM1 knockdown (shLETM1 #1, #2) cells, normalized to MitoTracker Green fluorescence. Data are means ± average deviation (n = 4). **p < 0.01, ***p < 0.005, one way ANOVA with Dunnett's multiple comparisons test.
Figure 4
Figure 4
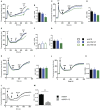
LETM1-mediated mitochondrial Ca2+ fluxes are Na+-dependent. (A) Representative trace of permeabilized scrambled control (shSCR) and LETM1 knockdown (shLETM1 #1, #2) cells in ICL buffer I (Na+ replete) containing Ca2+ Green 5N. Additions were made as indicated by arrows: Ca2+ (10 μM; 60 s), ruthenium red (RR) (0.2 μM; 200 s), FCCP (2 μM; 600/700 s). Recordings were performed at 25°C. (B) Quantification of Ca2+ efflux rate as shown in (A) between 200 and 400 s. Data shown are mean efflux rate ± SEM (n = 4). *p < 0.05, one way ANOVA with Dunnett's multiple comparisons test. (C) Representative trace of permeabilized scrambled control (shSCR) and LETM1 knockdown (shLETM1 #1, #2) cells in ICL buffer I (Na+ replete) containing Ca2+ Green 5N. Additions were made as indicated by arrows: Ca2+ (10 μM; 60 s), ruthenium 360 (R360) (1.4 μM; 200 s) the active ingredient in ruthenium red, FCCP (2 μM; 400 s). Recordings were performed at 37°C. (D) Quantification of Ca2+ efflux rate as shown in (C) between 200 and 400 s. Data shown are mean efflux rate ± average deviation (n = 2). (E) Representative trace of permeabilized scrambled control (shSCR) and LETM1 knockdown (shLETM1 #1, #2) cells in ICL buffer II (Na+-free) containing Ca2+ Green 5N. Additions were made as indicated by arrows: Ca2+ (10 μM; 60 s), RR (0.2 μM; 200 s), Na+ (10 mM; 400 s), FCCP (2 μM; 600/700 s). Recordings were performed at 25°C. (F) Quantification of Ca2+ efflux rate as shown in (E) between 200 and 400 s. Data shown are mean efflux rate ± SEM (n = 5). (G) Quantification of Ca2+ efflux rate as shown in (E) between 400 and 600 s. Data shown are mean efflux rate ± SEM (n = 5). *p < 0.05, one way ANOVA with Dunnett's multiple comparisons test. (H) Representative trace of permeabilized scramble control (shSCR) and LETM1 knockdown (shRNA #1, #2) as in (A) but in presence of CGP37175 an inhibitor of the Na+/Ca2+ exchanger (10 μM). (I) Quantification of Ca2+ efflux rate as shown in (H) between 200 and 400 s. Data shown are mean efflux rate ± SEM (n = 3–6). (J) Representative trace of permeabilized scramble control (shSCR) and LETM1 knockdown (shRNA #1, #2) as in (C) but in presence of CGP37175 as above. (K) Quantification of Ca2+ efflux rate as shown in (J) between 200 and 400 s. Data shown are mean efflux rate ± average deviation (n = 2). (L) Representative trace of permeabilized scrambled control (shSCR) cells treated with quinine (1 mM, dotted line) or vehicle control (ethanol, solid line) in ICL buffer I (Na+ replete) containing Ca2+ Green 5N. Additions were made as indicated by arrows: Ca2+ (10 μM; 60 s), RR (0.2 μM; 200 s), FCCP (2 μM; 400 s). Recordings were performed at 25°C. (M) Quantification of Ca2+ efflux rate as shown in (B). Data shown are mean efflux rate ± SEM (n = 3). **p < 0.01, unpaired students t-test.
Figure 5
Figure 5
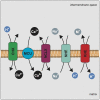
LETM1 dependent Ca2+ efflux is modulated by mitochondrial Na+ homeostasis. Mechanism illustrating the central players of the mitochondrial Ca2+ cycle and the proposed role of LETM1 in Ca2+ homeostasis. Stoichiometry of exchange is ignored for simplicity. Mitochondrial Calcium Uniporter (MCU) (blue circle) conducts the electrophoretic uptake of Ca2+ into mitochondria; this is regulated by members of the MCU core complex (EMRE, MICU1, MICU2). Mitochondrial Ca2+ efflux is executed by NCLX (SLC8B1) (purple rectangle) and the proposed Ca2+/H+ exchanger (CHX) (green rectangle). Na+ homeostasis is further regulated by a mitochondrial Na+/H+ exchanger (NHE) (teal rectangle), which would allow for the efflux of Na+. Additionally, mitochondrial K+/H+ exchange is executed by the KHE (LETM1) (red rectangle) a non-specific exchanger of monovalent cations (M+); the KHE can also extrude Na+. We propose that alteration of KHE activity by modulation of LETM1 levels affects Na+ homeostasis and this ultimately has an effect on Ca2+ release.

References

    1. Baughman J. M., Perocchi F., Girgis H. S., Plovanich M., Belcher-Timme C. A., Sancak Y., et al. . (2011). Integrative genomics identifies MCU as an essential component of the mitochondrial calcium uniporter. Nature 476, 341–345. 10.1038/nature10234 - DOI - PMC - PubMed
    1. Bernardi P. (1999). Mitochondrial transport of cations: channels, exchangers, and permeability transition. Physiol. Rev. 79, 1127–1155. - PubMed
    1. Bernardi P., Azzone G. F. (1983). Electroneutral H+-K+ exchange in liver mitochondria. regulation by membrane potential. Biochim. Biophys. Acta 724, 212–223. 10.1016/0005-2728(83)90140-8 - DOI - PubMed
    1. Blomen V. A., Májek P., Jae L. T., Bigenzahn J. W., Nieuwenhuis J., Staring J., et al. . (2015). Gene essentiality and synthetic lethality in haploid human cells. Science 350, 1092–1096. 10.1126/science.aac7557 - DOI - PubMed
    1. Blomeyer C. A., Bazil J. N., Stowe D. F., Dash R. K., Camara A. K. (2016). Mg(2+) differentially regulates two modes of mitochondrial Ca(2+) uptake in isolated cardiac mitochondria: implications for mitochondrial Ca(2+) sequestration. J. Bioenerg. Biomembr. 48, 175–188. 10.1007/s10863-016-9644-1 - DOI - PMC - PubMed

LinkOut - more resources