. 2017 Nov 17:8:2271.
doi: 10.3389/fmicb.2017.02271. eCollection 2017.

Flos Lonicera Combined with Metformin Ameliorates Hepatosteatosis and Glucose Intolerance in Association with Gut Microbiota Modulation

Affiliations

Flos Lonicera Combined with Metformin Ameliorates Hepatosteatosis and Glucose Intolerance in Association with Gut Microbiota Modulation

Na R Shin et al. Front Microbiol. .

Abstract

The gut microbiota is important in energy contribution, metabolism and immune modulation, and compositional disruption of the gut microbiota population is closely associated with chronic metabolic diseases like type 2 diabetes (T2D) and non-alcoholic fatty liver disease (NAFLD). Metformin (MET) and Flos Lonicera (FL) are common treatments for metabolic diseases in Western and Oriental medicinal fields. We evaluated the effect of treatment with FL and MET in combination on hepatosteatosis, glucose tolerance, and gut microbial composition. FL and MET were administered to Otsuka Long-Evans Tokushima Fatty (OLETF) rats, an animal model of genetic T2D and NAFLD. The FL+MET treatment reduced liver weight, serum cholesterol, insulin resistance, and hepatic MDA level and modulated the gut microbial composition. More specifically, the genera of Prevotella and Lactobacillus were negatively associated with the body and liver weights, hepatic TG and TC content, and serum insulin level. However, the relative abundance of these genera decreased in response to the FL+MET treatment. Interestingly, pathway prediction data revealed that the FL+MET treatment attenuated lipopolysaccharide-related pathways, in keeping with the decrease in serum and fecal endotoxin levels. FL and MET in combination exerts a synergistic effect on the improvement of hepatosteatosis and insulin sensitivity in OLETF rats, and modulates gut microbiota in association with the effect.

Keywords: Flos Lonicera; gut microbiota; hepatosteatosis; metabolic syndrome; metformin.


Figures

Figure 1
Figure 1
Effect of FL on the body and liver weights, histology, and fat accumulation in OLETF rats. The results depict body weight (A); liver weight (B); and relative liver weight (C). Histopathological observations of the liver tissues stained with hematoxylin-eosin (D) and Oil Red O (E) were carried out under light microscopy with 200X magnification (scale bar 100 μm, arrows indicate the lipid droplets). Data are expressed as mean ± SD (n = 7). ###P < 0.001 vs. LETO group; *P < 0.05 vs. OLETF group.
Figure 2
Figure 2
Effect of FL on lipid profiles and liver protein expression levels in OLETF rats. The concentration of total cholesterol (A), HDL cholesterol (B), and LDL cholesterol (C) in the serum of OLETF rats were measured. The content of and hepatic (D) and fecal total cholesterol (E) and hepatic TG (F) in OLETF rats were determined. The protein expression of SREBP-1c, HMGCoA reductase and phosphorylation levels of AMPK and ACC in the liver of OLETF rats were estimated by Western blotting. Representative blots from at least three individual experiments for each protein are shown (G). The density of the bands in each blot was quantified by densitometric analysis and expressed as pAMPK/AMPK, SREBP-1c/β-actin, pACC/β-actin, and HMGCoA reductase/β-actin. Data are expressed as mean ± SD (n = 7). ##P < 0.01; ###P < 0.001 vs. LETO group; *P < 0.05; **P < 0.01; ***P < 0.001 vs. OLETF group.
Figure 3
Figure 3
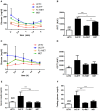
Effect of FL on the insulin sensitivity and glucose homeostasis in OLETF rats. The level of fasting serum glucose (A) and area under the curve (AUC) of intraperitoneal insulin tolerance test (IPITT) (B) were measured after treatment of the rats with insulin. The level of fasting serum glucose (C) and AUC of oral glucose tolerance test (OGTT) (D) were determined after the animals were administered glucose. The concentrations of serum insulin (E) and glucose (F) in the rats sampled at the termination of the experimental duration are depicted. Data are expressed as mean ± SD (n = 3). #P < 0.05; ###P < 0.001 vs. LETO group; *P < 0.05; **P < 0.01; ***P < 0.001 vs. OLETF group.
Figure 4
Figure 4
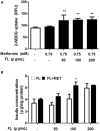
Effect of FL on glucose uptake and insulin secretion in in vitro test. Effect of treatment with 0.75 mM MET either alone or in combination with FL at 50, 100, 200 μ g/ml concentrations on the glucose uptake in C2C12 cells (A). Effect of treatment with FL at 50, 100, and 200 μ g/ml concentrations in absence or presence of 0.75 mM MET on the insulin secretion in INS-1 cells (B). Data are expressed as mean ± SD (n = 7). *P < 0.05; **P < 0.01 vs. control group.
Figure 5
Figure 5
Effect of FL on the liver injury and serum and fecal endotoxin levels in OLETF rats. Serum enzymatic activities of GOT (A) and GPT (B), liver lipid peroxidation (MDA level) (C), and serum and fecal endotoxin levels (D, E, respectively) in OLETF rats are shown. Data are expressed as mean ± SD (n = 7); #P < 0.05; ##P < 0.01 vs. LETO group; *P < 0.05; ***P < 0.001 vs. OLETF group.
Figure 6
Figure 6
Alteration of structure of gut microbiota by FL in OLETF rats. (A) PCoA score plot calculated from OTU levels by QIIME was subjected to unweighted UniFrac analysis. (B) Composition profiles of gut microbiota at family and class levels. (C) Heatmap and clustering of individual gut microbiota in 150 OTUs.
Figure 7
Figure 7
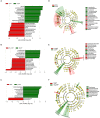
Inter-group variation in the relative abundances of gut microbial communities. Taxonomic comparison of the gut microbiota is demonstrated as follows: LETO vs. OLETF (A), FL+MET vs. OLETF (B), and MET vs. OLETF (C). Circular cladograms depicting the LEfSe results are as follows: LETO vs. OLETF (D), FL+MET vs. OLETF (E), and MET vs. OLETF (F). The alpha value for the factorial Kruskal-Wallis test is <0.05 and the threshold on the logarithmic LDA score for discriminative feature is >2.0.
Figure 8
Figure 8
Correlation between gut microbiota and clinical parameters in OLETF rats. Heatmap of correlation between the alterations in gut microbial population and the changes in host parameters related to obesity and metabolic disorders, liver integrity, and lipid peroxidation. Pearson correlation values were used for the matrix. “formula image” Denotes adjusted P < 0.05.
Figure 9
Figure 9
Prediction of metabolic function in OLETF rats. Microbial gene functions in the rats of different experimental groups as indicated using PiCRUSt bioinformatics software package. Results are showing relative abundance of biological entities and characteristics (A), metabolic diseases (B), metabolism (C), and glycan biosynthesis and metabolism (D). Data are expressed as mean ± SED (n = 4); *P < 0.05; **P < 0.01; ***P < 0.001 vs. OLETF group.

References

    1. Abu-Shanab A., Quigley E. M. (2010). The role of the gut microbiota in nonalcoholic fatty liver disease. Nat. Rev. Gastroenterol. Hepatol. 7, 691–701. 10.1038/nrgastro.2010.172 - DOI - PubMed
    1. Asfari M., Janjic D., Meda P., Li G., Halban P. A., Wollheim C. B. (1992). Establishment of 2-mercaptoethanol-dependent differentiated insulin-secreting cell lines. Endocrinology 130, 167–178. 10.1210/endo.130.1.1370150 - DOI - PubMed
    1. Bajzer M., Seeley R. J. (2006). Physiology: obesity and gut flora. Nature 444, 1009–1010. 10.1038/4441009a - DOI - PubMed
    1. Bell D. (2010). Metformin-induced vitamin B12 deficiency presenting as a peripheral neuropathy. South. Med. J. 103, 265–267. 10.1097/SMJ.0b013e3181ce0e4d - DOI - PubMed
    1. Bosi E. (2009). Metformin–the gold standard in type 2 diabetes: what does the evidence tell us? Diabetes Obes. Metab. 11, 3–8. 10.1111/j.1463-1326.2008.01031.x - DOI - PubMed

LinkOut - more resources