. 2017:1:724-735.
doi: 10.1038/s41551-017-0128-3. Epub 2017 Sep 4.

Laser-emission imaging of nuclear biomarkers for high-contrast cancer screening and immunodiagnosis

Affiliations

Laser-emission imaging of nuclear biomarkers for high-contrast cancer screening and immunodiagnosis

Yu-Cheng Chen et al. Nat Biomed Eng. 2017.

Abstract

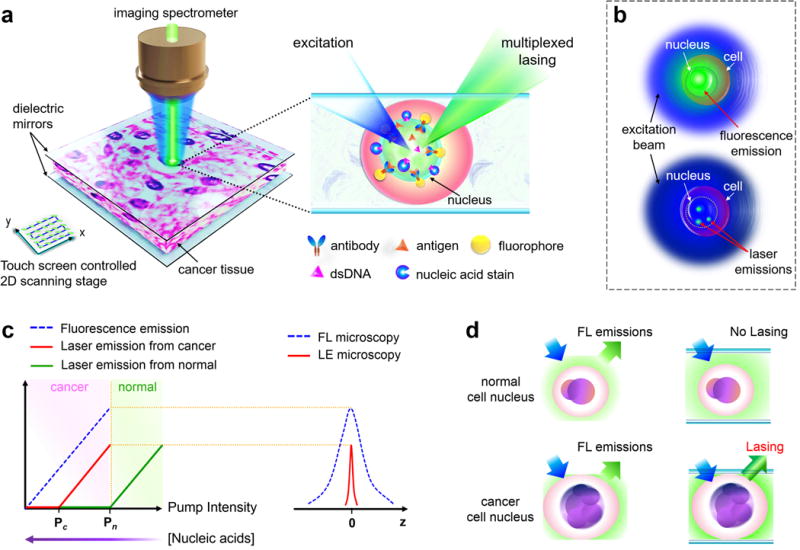
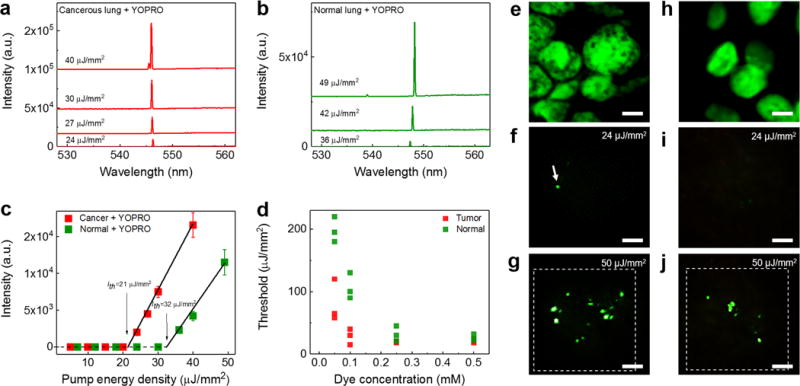
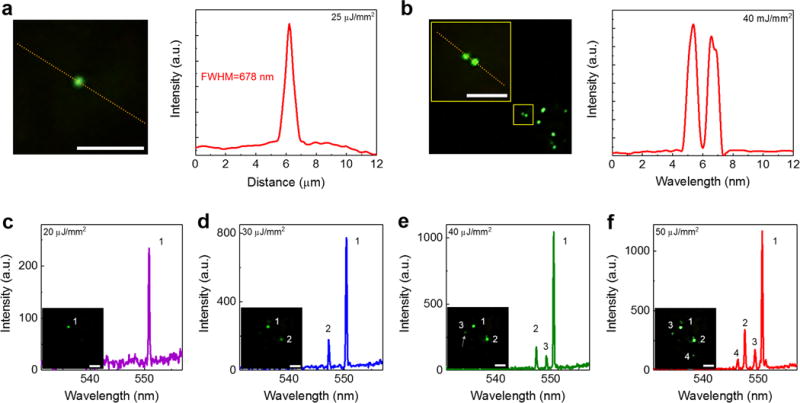
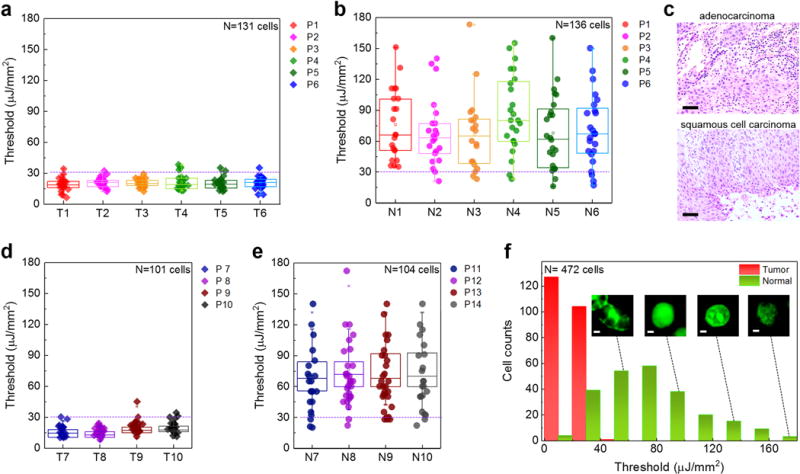
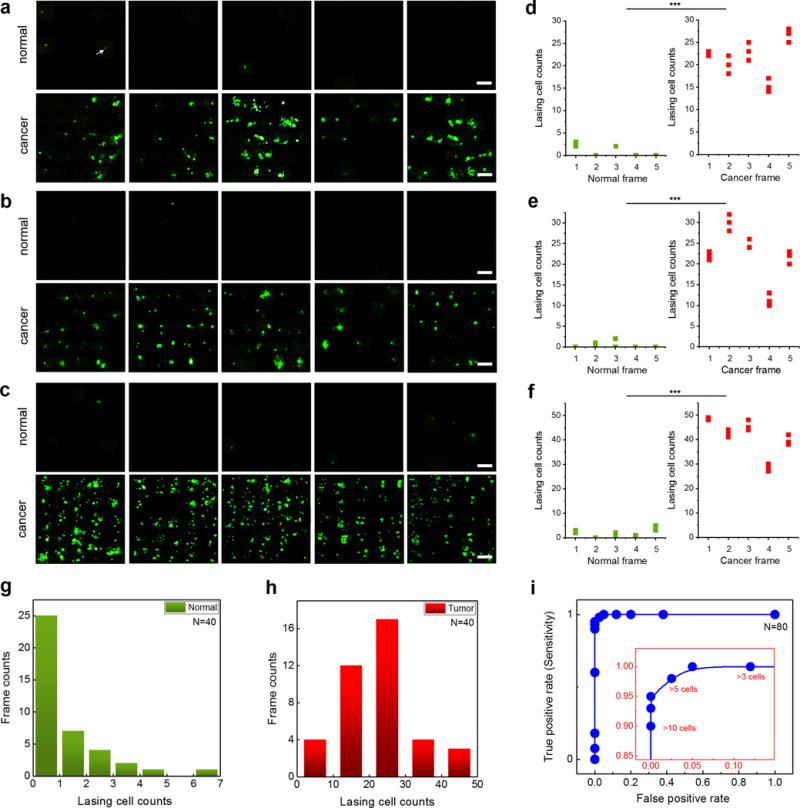
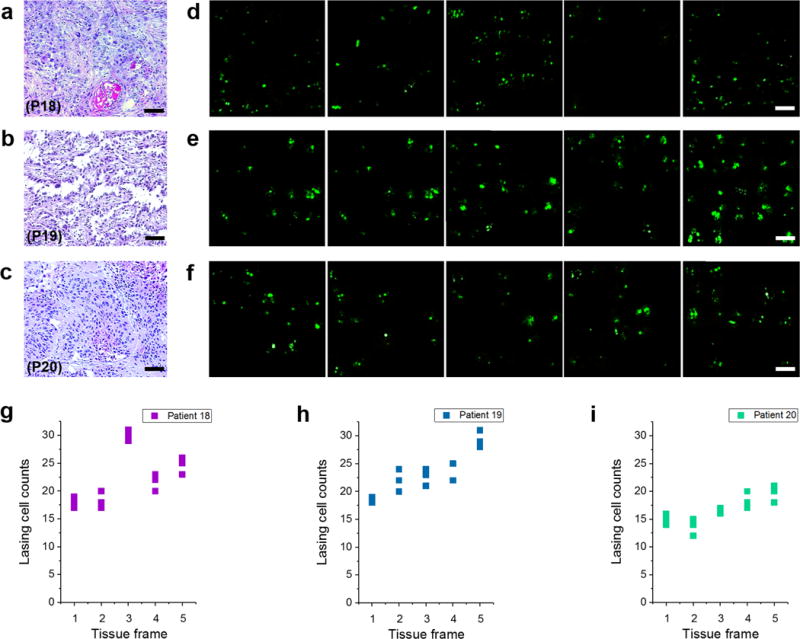
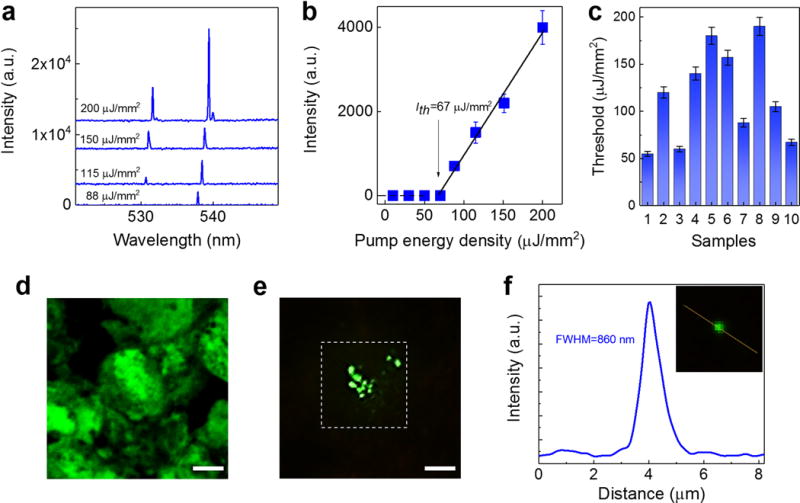
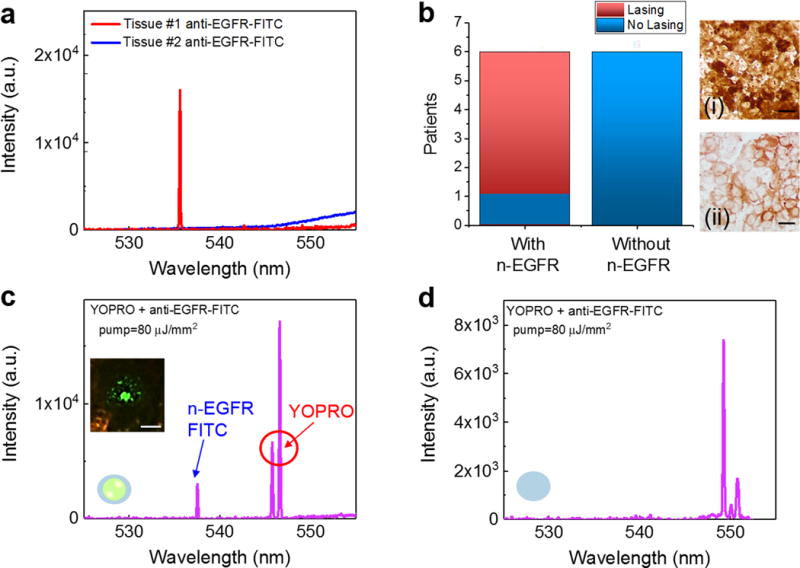
Detection of nuclear biomarkers such as nucleic acids and nuclear proteins is critical for early-stage cancer diagnosis and prognosis. Conventional methods relying on morphological assessment of cell nuclei in histopathology slides may be subjective, whereas colorimetric immunohistochemical and fluorescence-based imaging are limited by strong light absorption, broad-emission bands and low contrast. Here, we describe the development and use of a scanning laser-emission-based microscope that maps lasing emissions from nuclear biomarkers in human tissues. 41 tissue samples from 35 patients labelled with site-specific and biomarker-specific antibody-conjugated dyes were sandwiched in a Fabry-Pérot microcavity while an excitation laser beam built a laser-emission image. We observed multiple sub-cellular lasing emissions from cancer cell nuclei, with a threshold of tens of μJ/mm2, sub-micron resolution (<700 nm), and a lasing band in the few-nanometre range. Different lasing thresholds of nuclei in cancer and normal tissues enabled the identification and multiplexed detection of nuclear proteomic biomarkers, with a high sensitivity for early-stage cancer diagnosis. Laser-emission-based cancer screening and immunodiagnosis might find use in precision medicine and facilitate research in cell biology.

Keywords: Fabry-Pérot cavity; cancer; diagnosis; lasers; microscopy; multiplexed detection; nuclear biomarkers; nucleic acids; sub-cellular resolution; tissues.


Conflict of interest statement

Additional Information. The authors declare no competing financial interests.

Figures

Figure 1
Figure 1. Conceptual illustration of the laser-emission based microscope
a, Illustration of the laser-emission based microscope (LEM) configuration when a human cancer tissue is sandwiched within a high-Q Fabry-Pérot cavity and integrated with a 2D raster scanning stage. The laser emission from fluorophores is achieved upon external excitation. The inset shows the details of using nucleic acid staining dyes and antibody-conjugated dyes to achieve multiplexed laser emissions from a tissue. Laser emissions are achieved only when probes are bound to the nucleus or targeted nuclear biomarker within the tissue. Here only one antibody is plotted for example; however, multiple targeted antibodies/fluorophores can be used. b, Comparison between the traditional fluorescence emission (top) and “star-like” laser emission (bottom) from a single nucleus. c, (Left) Output intensity of laser emission as a function of pump intensity. Pc, lasing threshold of cancer cell lasing; Pn, lasing threshold of normal cell lasing. A higher/lower nucleic acid concentration leads to a lower/higher lasing threshold. (Right) Laser emission (red solid line) has a much narrower emission profile than traditional fluorescence (blue dashed line) d, Fluorescence emission is detected in both normal and cancer cell nuclei, whereas laser emission can be detected only in cancer cell nuclei when pump energy density is set between Pc and Pn.
Figure 2
Figure 2. Lasing in lung tissue with nucleic acid staining dye
a and b, Examples of lasing spectra of a human lung cancer tissue (a) and normal lung tissue (b), stained with YOPRO under various pump energy densities. Curves are vertically shifted for clarity. c, Comparison of spectrally integrated (540 nm – 550 nm) laser output as a function of pump energy density extracted from the spectra in a and b. The solid lines are the linear fit above the lasing threshold, indicating a lasing threshold of 21 μJ/mm2 for cancer tissue and 32 μJ/mm2 for normal lung tissue. The error bars (s.d.) are defined by considering the pump energy density variation of OPO pulsed laser during the measurements. d, Lasing threshold with different concentrations of YOPRO used to stain the tissue. Three individual measurements were measured for each concentration at different sites, as presented individually in green and red squares. e, Confocal fluorescence image of a lung cancer nucleus (shown in green). f-g, CCD images of the laser output from a nucleus in a lung cancer tissue (f) around (24 μJ/mm2) and (g) far above (50 μJ/mm2) the lasing threshold. The image shows clearly several sharp “lasing stars” within the nucleus, whereas the background fluorescence is significantly suppressed. h, Confocal image of a normal lung nucleus (in green). i-j, CCD images of the laser output from a nucleus in a normal lung tissue (i) below (24 μJ/mm2) and (j) above (50 μJ/mm2) the lasing threshold. Note that e/h and g/j were taken from the same piece of tissue, but does not exactly represent the same cells. All the tissues in a-j were stained with YOPRO (0.5 mM in bulk staining solution) under the same preparation conditions. The dashed squares in g and j show the laser pump beam area in LEM. All scale bars, 5 μm. The corresponding H&E images of the cancer tissues and normal tissues are provided in Supplementary Fig. 3.
Figure 3
Figure 3. Optical resolution of sub-cellular lasers under LEM
a, Enlarged CCD image (left) of a single laser emission star from a human lung tissue stained with YOPRO. The intensity profile along the yellow dotted line (right) shows the FWHM of 678 nm. b, Enlarged CCD image (left) of two adjacent lasing stars. The yellow square identifies the location of two lasing stars within the tissue. The intensity profile along the yellow dotted line (right) shows two well-resolved peaks. The smallest resolvable distance between two laser emissions is estimated to be better than 1 μm. c-f, Lasing spectra of independent sub-cellular lasers within the same focal beam spot by increasing the pump energy density from (c) 20 μJ/mm2, (d) 30 μJ/mm2, (e) 40 μJ/mm2, to (f) 50 μJ/mm2. The insets show the CCD images of corresponding laser emissions, in which c is an example of a single lasing star, d is an example of two independent lasing stars with different lasing thresholds, e is an example of three independent lasing stars with different lasing thresholds, and f is an example of multiple independent lasing stars emerging simultaneously at a high pump energy density. Note that the slight increase in the background emission beyond 560 nm in c-e is due to the fluorescence leaking out of the FP cavity caused by the reduced reflectivity of the dielectric mirror (see Supplementary Fig. 2 for details). NA= 0.42. All scale bars, 5 μm.
Figure 4
Figure 4. Statistics of cancer/normal cell lasing thresholds
a, Statistics of tumor cell lasing thresholds from six individual lung cancer patients (P1, P2, P3, P4, P5, P6), labeled as Tumor tissue, T1-T6. For each patient, at least 20 cells were randomly selected and measured. b, Statistics of normal cell lasing thresholds of normal lung tissues from the same six patients (P1-P6) in a, labeled as Normal tissue N1-N6. c, Exemplary H&E microscopic images of the two major types of non-small lung cancers used in this work, including andenocarcinoma (top) for P1-P3 and squamous cell carcinoma (bottom) for P4-P6. Scale bars, 100 μm. d, Statistics of tumor cell lasing thresholds from four different lung cancer patients (P7, P8, P9, P10), labeled as Tumor tissue, T7- T10. e, Statistics of normal cell lasing thresholds of normal lung tissues from four different control patients (P11-P14), labeled as Normal tissue N7-N10. For each patient, at least 20 cells were randomly selected and measured. The error bars (s.d.) in a, b, d and e are defined by the lasing threshold variation of 20 cells measured from each patients, respectively. The statistical box plots are also shown in the same figure in a, b, d and e. The dashed purple lines in a, b, d, and e indicate the cutoff threshold of 30 μJ/mm2. f, Histogram of all cancer/normal cell lasing thresholds (N=472) extracted from a, b, d and e. The insets show the confocal fluorescence images of normal cells at different cell phases. Scale bars, 1 μm. The H&E images of the cancer tissues and normal tissues of entire 14 patients, P1-P14, are provided in Supplementary Fig. 7.
Figure 5
Figure 5. Comparison and statistics of laser-emission microscopic images of normal/cancer tissues
a–c, LEM images by mapping the nucleic acids in normal and lung cancer tissues of (a) Patient 15, (b) Patient 16, and (c) Patient 17. For each patient, five normal/cancer tissue sections (frames) were scanned under a fixed pump energy density of 30 μJ/mm2. The white arrow in a points an example of a single lasing star in a normal tissue of Patient 1. NA= 0.42. All scale bars, 20 μm. Each frame is 150 μm × 150 μm. The corresponding H&E images of the cancer tissues and normal tissues of the three patients are provided in Supplementary Fig. 8. All three patients’ tissues were examined by pathologists and diagnosed as lung cancer. (P15: Stage II, P16: Stage I, P17: Stage I lung cancer). d-f, Statistics of the number of cells per frame that have laser emission from their respective nuclei for (d) Patient 15, (e) Patient 16, and (f) Patient 17 extracted from the LEM images in a-c. Green/red dots represent for the normal/cancer tissues, respectively. The lasing cell counts were calculated three times for each tissue frame as plotted in d-f. g, Histogram of frame counts based on the number of the lasing cells per frame in normal tissues from 8 different patients (P1, P3, P5, P6, P10, P15, P16, P17). For each patient, five frames (150 μm × 150 μm) were scanned under a fixed pump energy density of 30 μJ/mm2. h, Histogram of frame counts based on the number of the lasing cells per frame in cancer tissues from 8 different patients (P1, P3, P5, P6, P10, P15, P16, P17). For each patient, five frames (150 μm × 150 μm) were scanned under a fixed pump energy density of 30 μJ/mm2. i, Receiver Operating Characteristics (ROC) curve based on the 80 frames (40 normal tissue sections, 40 tumor tissue sections) in g and h. The ROC curve is plotted by using the different lasing cell counts per frame. The area under the curve is 0.998. The inset shows the enlarged part of the ROC curve, in which the sensitivity of 97.5% is obtained based on the criterion of >5 lasing cells per LEM frame.
Figure 6
Figure 6. Laser-emission microscopic images of early stage lung cancer tissues
a–c, H&E images of (a) Patient 18 (P18), (b) Patient 19 (P19), and (c) Patient 20 (P20), who are identified as in-progress or early stage lung cancer. d-f, The corresponding LEM images by scanning the nucleic acids of the tissues from the same three patients. For each patient, five tissue sections (frames) were scanned under a fixed pump energy density of 30 μJ/mm2. g-i, Statistics of the number of cells having lasing emission from nuclei extracted from the LEM images. The lasing cell counts were calculated three times for each tissue frame as plotted in g-i. NA= 0.42. Scale bars for a-c, 100 μm; d-f, 20 μm.
Figure 7
Figure 7. Lasing in lung cancer tissue with anti-EGFR-FITC
a, Examples of lasing spectra of a human lung cancer tissue with n-EGFR expression stained with anti-EGFR-FITC under various pump energy densities. Curves are vertically shifted for clarity. b, Spectrally integrated (530 nm – 540 nm) laser output as a function of pump energy density extracted from the spectra in a. The solid lines are the linear fit above the lasing threshold, indicating a lasing threshold of 67 μJ/mm2. c, Histogram of n-EGFR-FITC lasing thresholds measured from 10 cells (samples) out of 5 lung cancer patients (patients P21-P25: including squamous cell carcinoma and andenocarcinoma tissues). The error bars (s.d.) in both b and c are defined by considering the pump energy density variation of OPO pulsed laser during the measurements. d, Confocal microscopic image of a cell with n-EGFR expression in the lung cancer tissue. e, CCD images of the laser output from the same lung cancer tissue above the lasing threshold (125 μJ/mm2). The image shows clearly several “lasing stars” corresponding to the highest concentrated EGFR locations within the nuclei. The dashed square shows the laser pump beam area in LEM, which is focused on only one of the cells in the tissue. Note that d and e are not from the identical cells, but from the same piece of tissue. f, The intensity profile along the yellow dotted line (inset) shows the FWHM is measured to be 860 nm. All the tissues in a-e were stained with anti-EGFR-FITC (0.5 mM in bulk staining solution) under the same preparation conditions. NA=0.42. All scale bars, 10 μm.
Figure 8
Figure 8. Multiplexed lasing in lung cancer tissues
a, Lasing spectra of Type #1 (red curve) and Type #2 (blue curve) tissues stained with anti-EGFR-FITC. Pump energy density=80 μJ/mm2. b, Statistics of the EGFR lasing results for positive and negative n-EGFR lasing from 12 patients (P21-P32). Details and H&E images are provided Supplementary Fig. 13. (i) Brightfield IHC image of a human lung cancer tissue with n-EGFR (Tissue type #1). (ii) Brightfield IHC of a human lung cancer tissue without n-EGFR overexpression (Tissue type #2). c, Lasing spectra of a Type #1 tissue dual-stained with YOPRO and EGFR-anti-FITC. The laser was focused on a single nucleus within the lung cancer tissue. The pump energy density was set above the threshold for both YOPRO and FITC under single excitation wavelength. The inset CCD image is the demonstration of a n-EGFR laser emission, which indicates that EGFR co-localizes with the nucleus. d, Lasing spectra of a Type #2 tissue dual-stained with YOPRO and anti-EGFR-FITC. The laser was focused on a single nucleus within the lung cancer tissue. Note that the slight increase in the background emission beyond 550 nm in a and c is due to the fluorescence leaking out of the FP cavity caused by the reduced reflectivity of the dielectric mirror (see Supplementary Fig. 2). Scale bars, 20 μm.

Similar articles

Cited by

References

    1. Zink D, Fischer AH, Nickerson JA. Nuclear structure in cancer cells. Nat Rev Cancer. 2004;4:677–687. - PubMed
    1. Swarup V, Rajeswari M. Circulating (cell-free) nucleic acids–a promising, non-invasive tool for early detection of several human diseases. FEBS Lett. 2007;581:795–799. - PubMed
    1. Schwarzenbach H, Hoon DS, Pantel K. Cell-free nucleic acids as biomarkers in cancer patients. Nat Rev Cancer. 2011;11:426–437. - PubMed
    1. Morgan MA, Shilatifard A. Chromatin signatures of cancer. Genes & Dev. 2015;29:238–249. - PMC - PubMed
    1. Lo H, Hung M. Nuclear EGFR signalling network in cancers: linking EGFR pathway to cell cycle progression, nitric oxide pathway and patient survival. Br J Cancer. 2006;94:184–188. - PMC - PubMed