. 2017 Mar 6;4(1):165-182.e7.
doi: 10.1016/j.jcmgh.2017.02.011. eCollection 2017 Jul.

Self-renewing Monolayer of Primary Colonic or Rectal Epithelial Cells

Affiliations

Self-renewing Monolayer of Primary Colonic or Rectal Epithelial Cells

Yuli Wang et al. Cell Mol Gastroenterol Hepatol. .

Abstract

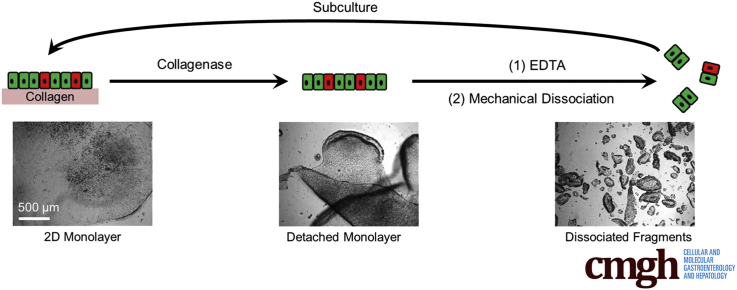
Background & aims: Three-dimensional organoid culture has fundamentally changed the in vitro study of intestinal biology enabling novel assays; however, its use is limited because of an inaccessible luminal compartment and challenges to data gathering in a three-dimensional hydrogel matrix. Long-lived, self-renewing 2-dimensional (2-D) tissue cultured from primary colon cells has not been accomplished.

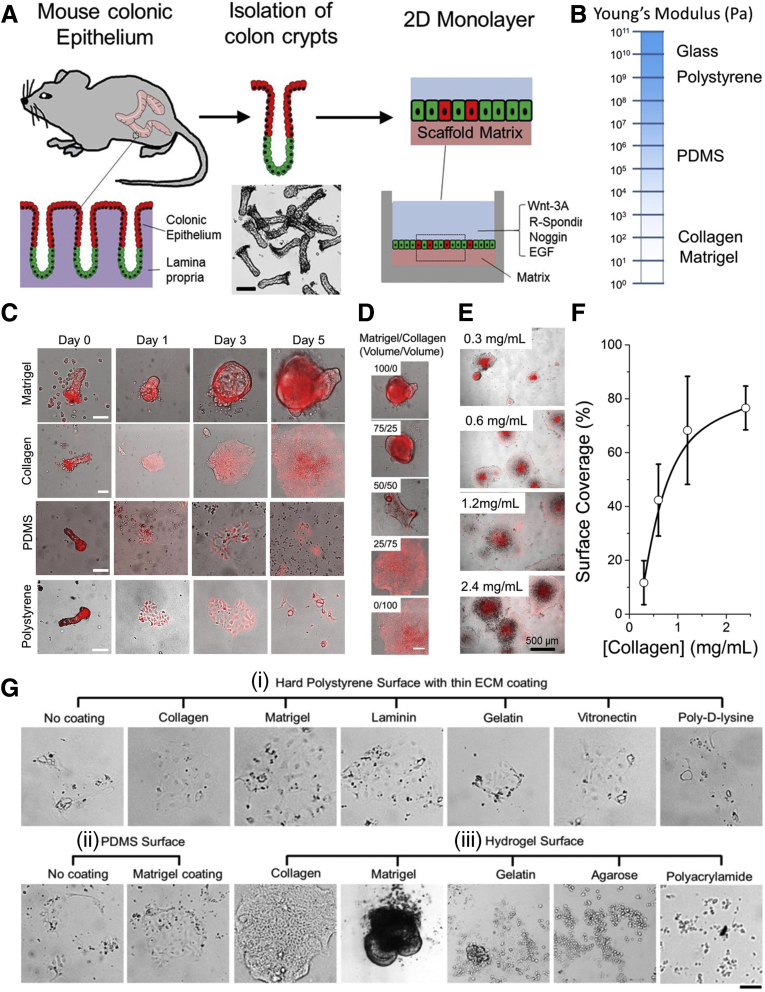
Methods: The surface matrix and chemical factors that sustain 2-D mouse colonic and human rectal epithelial cell monolayers with cell repertoires comparable to that in vivo were identified.

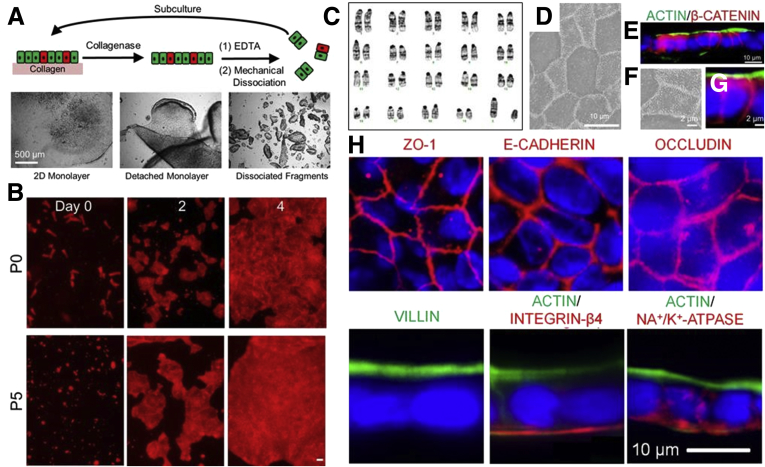
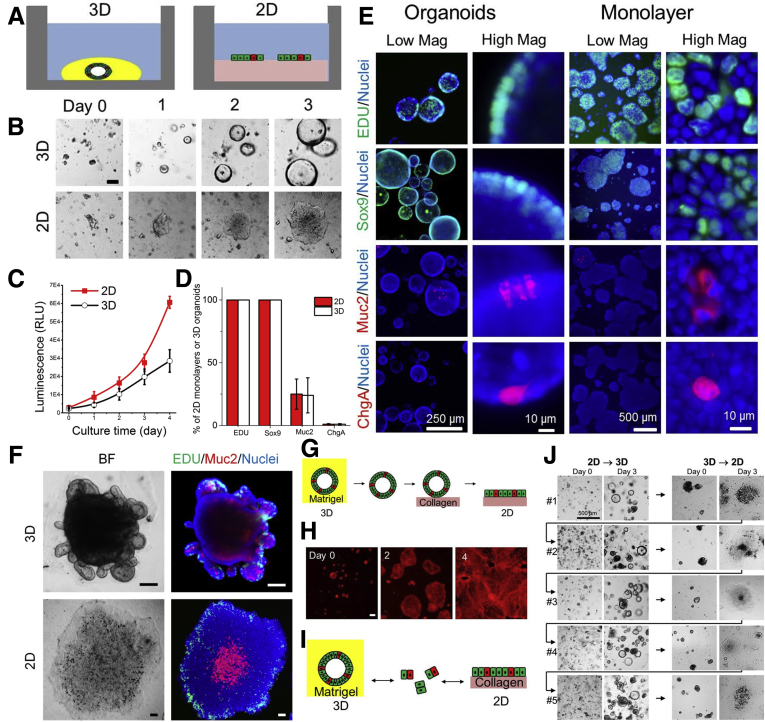
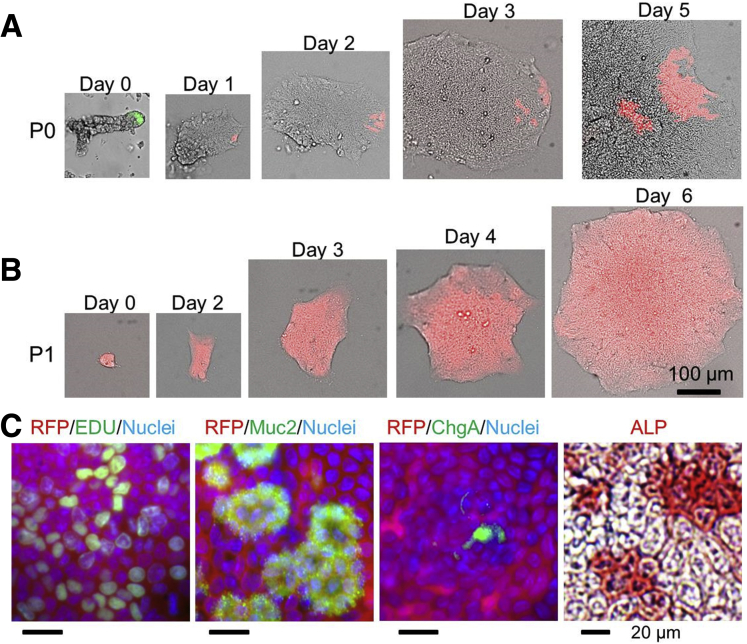
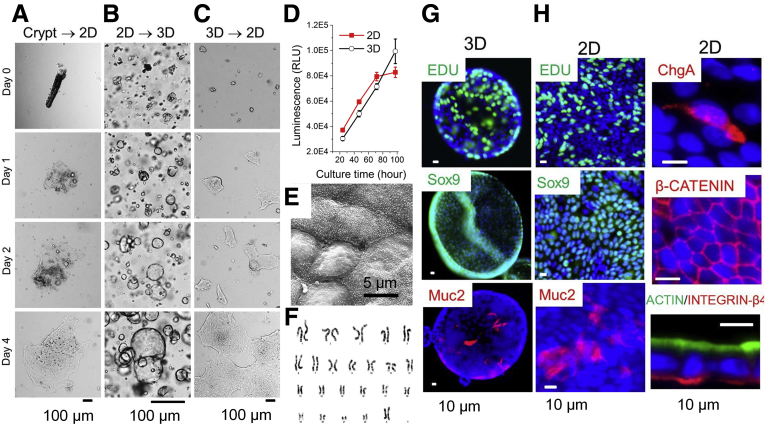
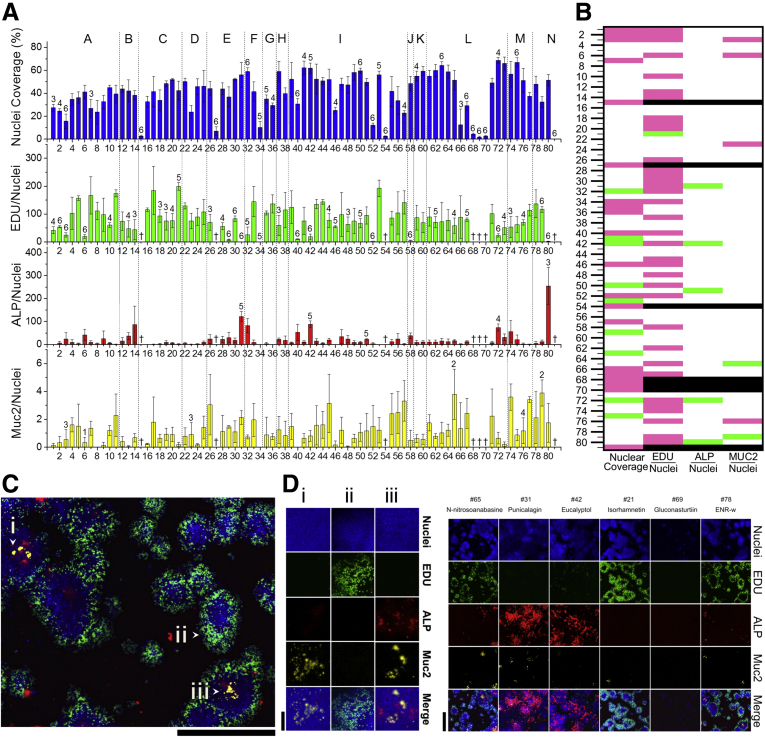
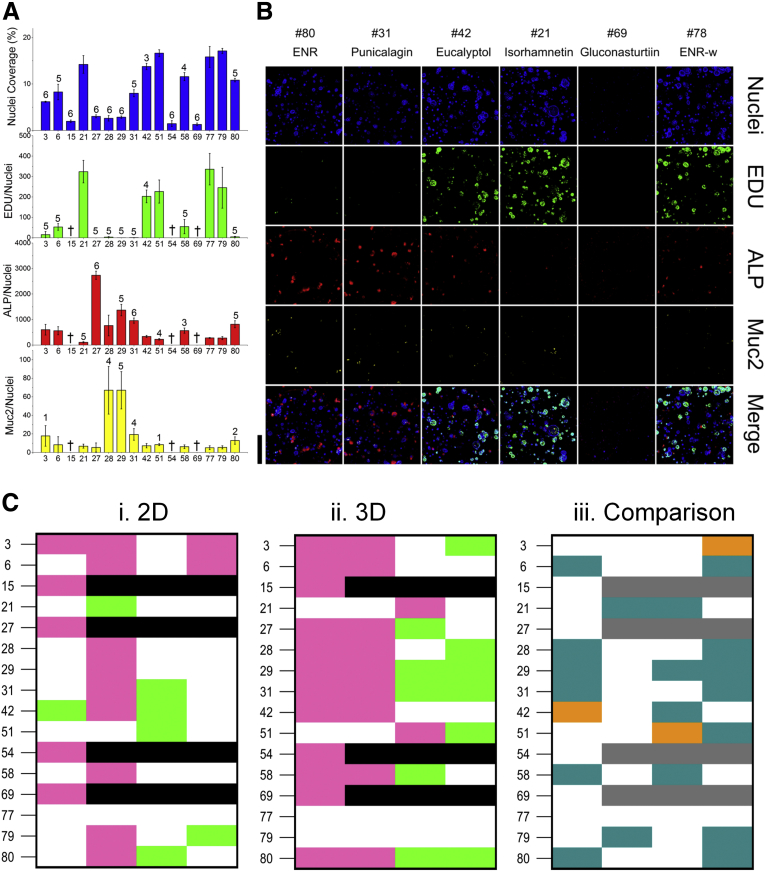
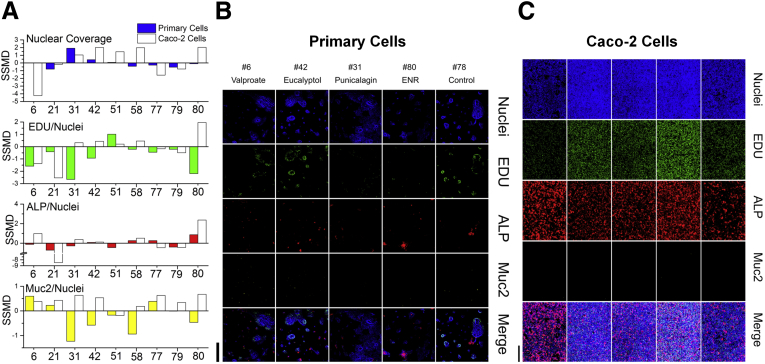
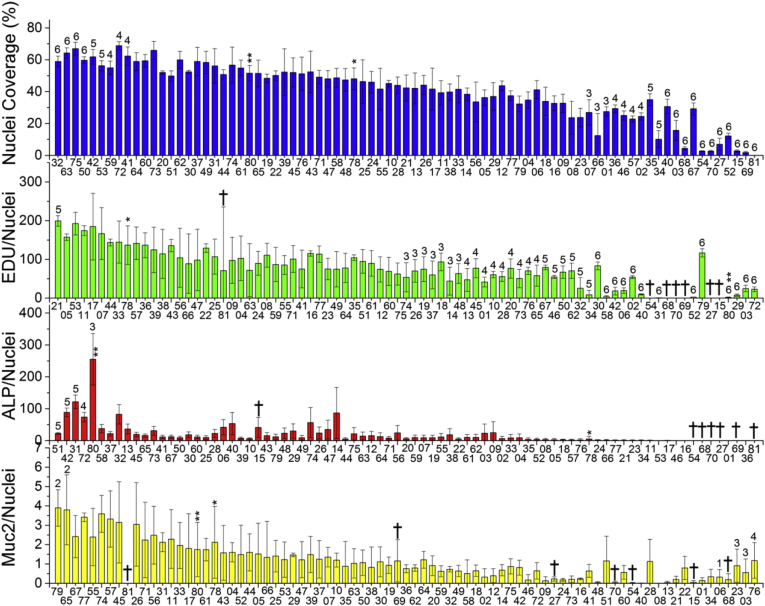
Results: The monolayers formed organoids or colonoids when placed in standard Matrigel culture. As with the colonoids, the monolayers exhibited compartmentalization of proliferative and differentiated cells, with proliferative cells located near the peripheral edges of growing monolayers and differentiated cells predominated in the central regions. Screening of 77 dietary compounds and metabolites revealed altered proliferation or differentiation of the murine colonic epithelium. When exposed to a subset of the compound library, murine organoids exhibited similar responses to that of the monolayer but with differences that were likely attributable to the inaccessible organoid lumen. The response of the human primary epithelium to a compound subset was distinct from that of both the murine primary epithelium and human tumor cells.

Conclusions: This study demonstrates that a self-renewing 2-D murine and human monolayer derived from primary cells can serve as a physiologically relevant assay system for study of stem cell renewal and differentiation and for compound screening. The platform holds transformative potential for personalized and precision medicine and can be applied to emerging areas of disease modeling and microbiome studies.

Keywords: 2-D, two-dimensional; 3-D, three-dimensional; ALP, alkaline phosphatase; CAG, cytomegalovirus enhancer plus chicken actin promoter; CI, confidence interval; Colonic Epithelial Cells; Compound Screening; ECM, extracellular matrix; EDU, 5-ethynyl-2′-deoxyuridine; EGF, epidermal growth factor; ENR-W, cell medium with [Wnt-3A] of 30 ng/mL; ENR-w, cell medium with [Wnt-3A] of 10 ng/mL; HISC, human intestinal stem cell medium; IACUC, Institutional Animal Care and Use Committee; ISC, intestinal stem cell; Monolayer; Organoids; PBS, phosphate-buffered saline; PDMS, polydimethylsiloxane; RFP, red fluorescent protein; SEM, scanning electron microscope; SSMD, strictly standardized mean difference; UNC, University of North Carolina; α-ChgA, anti-chromogranin A; α-Muc2, anti-mucin2.


Figures

None
Graphical abstract
Figure 1
Figure 1
The 2-D monolayer culture of murine colonic crypts on surface of variety of substrates with different surface properties and stiffness. (A) Workflow for culturing crypts on matrix surface. Wnt-3A, R-spondin, noggin, and EGF are used in the culture medium. Proliferative stem cells and progenitors (green); differentiated cells (red). (B) Spectrum of Young’s modulus of typical materials used in cell culture. Young’s modulus of collagen hydrogel is in the range of 10–1000 Pa, depending on source, type, and concentration of collagen and characterization method. (C) Time-lapse images of crypts cultured on top of 4 matrices with different stiffness: Matrigel (top panel), collagen (100 vol%, second panel), PDMS (third panel), and polystyrene (bottom panel). Shown are overlaid brightfield and DsRed fluorescence images. Crypts were derived from a mouse expressing DsRed in all cells under a chicken-actin promoter. Mouse colon crypts were plated on the surfaces at low density of 1 crypt/cm2 (to track growth of individual crypts) cultured for 5 days. None of the crypts on PDMS and polystyrene formed an expanding monolayer (n = 3 wells, 10 crypts/well). (D) Overlaid brightfield and DsRed images of mouse colonic crypts (CAG-DsRed mouse) cultured on top of mixture of Matrigel/collagen at day 5. (E) Brightfield images of primary mouse colonic epithelial cells cultured for 3 days on surface of collagen hydrogel prepared at 4 concentrations (0.3, 0.6, 1.2, and 2.4 mg/mL). (F) Surface coverage of cells is plotted against concentration of the hydrogel by using data from (E). (G) Culture of mouse colonic crypts on variety of substrates with or without surface coatings. (i) Hard polystyrene surface with different ECM coatings. (ii) PDMS with and without Matrigel coating. (iii) Various hydrogels. Cells proliferated only on collagen and Matrigel. Scale bar = 100 μm unless denoted otherwise.
Figure 2
Figure 2
Growth of proliferative 2D monolayer of murine epithelium on surface of collagen hydrogel. (A) Workflow for subculturing 2-D monolayers. Monolayers are dissociated from collagen and split. Brightfield images (bottom) show cell preparation at different workflow stages. (B) Time lapse fluorescence (DsRed) images of crypt-derived cells on collagen at passage number 0 (P0, crypts) and passage number 5 (P5). Scale bar =100 μm. (C) Karyotype analysis of 2-D monolayer at passage number 5 showing a normal karyotype. (D) SEM image of monolayer on collagen gel at day 3 of culture. (E) Fluorescence image of cross section through the monolayer immunostained for actin (green) and β-catenin (red). Distribution of β-catenin (an intracellular protein) demonstrated columnar-shaped cells with height of 9.4 ± 0.8 μm and width of 7.5 ± 0.9 μm (n = 10). (F) High magnification view of subregion of (D). (G) High magnification view of subregion of (E). (H) Staining for ZO-1, E-cadherin, or occludin (red); villin or actin (green); integrin-β4 and NA+/K+-ATPase (red). Nuclei (blue).
Figure 3
Figure 3
Proliferative capacity, lineage composition, and compartmentalization are highly similar between 2-D murine colonic monolayers and 3-D organoids. (A) Schematic showing culture format for organoids and monolayers. (B) Time-lapse brightfield images demonstrating growth and morphology of crypt-derived organoids and monolayers at passage number 2 (P2). (C) Quantification of cellular growth over time in organoids and monolayers measured by proxy assay (CellTiter-Glo luminescence, n = 4). (D) Percentage of monolayer patches and organoids at day 3 demonstrating positive staining for proliferative and differentiated cell lineages (EDU, SOX9, Muc2, and ChgA; n = 3, 20 monolayer patches or organoids per experiment). (E) Fluorescence images of organoids and monolayers at day 3 (EDU [green], SOX9 [green], Muc2 [red], ChgA [red], and nuclei [blue]). (F) Compartmentalization of proliferative stem/progenitor cells and differentiated cells. Brightfield (left column) and fluorescence (right column) images of organoids (top row) and monolayers (bottom row) at culture day 8 (EDU [green], Muc2 [red], and nuclei [blue]). Of the 3-D mature organoids, 80% ± 10% (10 organoids/well, n = 3 wells) demonstrated increased stem/progenitors (EDU+) collections in the buds, whereas 100% ± 0% (10 monolayer patches/well, n = 3 wells) of the monolayers demonstrated EDU+ cells localized to periphery of the patch. In a majority (83% ± 6%, 10 monolayer patches/well, n = 3 wells) of monolayer patches, Muc2+ was found only in central-most region of the patch. Mucin was present in the lumen of all 3-D organoids. (G) Schematic showing conversion of 3-D organoids into 2-D monolayers. (H) DsRed fluorescence images of organoid placement and culture on collagen hydrogel at days 0, 2, and 4. The organoid spreads on the surface to become a cell monolayer. (I) Schematic of interconversion of organoids and monolayers performed in panel (J). (J) Representative images of 5 sequential, interconverting passages from 2-D monolayer to 3-D organoid and back again. Unlike 3-D organoids with enclosed lumen, the epithelial monolayer on collagen possessed an accessible luminal surface. Scale bar = 100 μm unless denoted otherwise.
Figure 4
Figure 4
Lineage tracing of mouse colonic epithelial cells in 2-D monolayer. (A) Time-lapse images after isolation and culture of single colonic crypt from tamoxifen-injected Lgr5EGFPCreERT2xR26 confetti mouse. Presence of stem cells or Lgr5+ cells (green, EGFP) is readily seen at day 0. At day 1 and later, a tracing event is observed, with expression of RFP (red) marking the progeny of a single stem cell. (B) Post-isolation and passage of RFP+ cells from (a). (C) EDU, Muc2, ChgA, and ALP stains of monolayers of RFP+ cells revealed that the monolayer was composed of proliferative cells (EDU+, in presence of Wnt-3A) and differentiated cells (Muc2+ goblet cells, ChgA+ enteroendocrine cells, ALP+ absorptive colonocytes) in absence of Wnt-3A.
Figure 5
Figure 5
Human rectal epithelial cells can be cultured as proliferative 2-D monolayer. (A) Crypt cultured on top of collagen hydrogel grew as 2-D monolayer. (B) Conversion of fragments of 2-D monolayer to 3-D organoids. The 3-D organoids possessed a thin wall and cystic structure. (C) Conversion of 3-D organoids to 2-D monolayer. The 3-D organoids were extracted from Matrigel (day 4 in culture) and plated on top of collagen hydrogel. (D) Cellular growth over time in organoids and monolayers measured by cell viability assay (CellTiter-Glo luminescence, n = 3). (E) SEM image of monolayer on collagen hydrogel at day 3 of culture. (F) Karyotype analysis of 2-D monolayer at passage 6 showing normal karyotype. (G) Fluorescence images of organoids showing EDU staining (green, at day 3), Sox9 (green, at day3), and Muc2 (red, at day 6) immunostaining. (H) Fluorescence images of monolayers showing EDU staining (green, at day 3), Sox9 (green, at day3), Muc2 (red, at day 6), ChgA (red, at day 6), β-catenin (red, at day 6), actin (green), and integrin-β4 (red, at day 6) immunostaining. In all images Hoechst 33342 (blue) marked the nuclei.
Figure 6
Figure 6
Impact of dietary compounds and natural products on primary murine colonic monolayers. (A) Percentage of collagen surface area that was positive for Hoechst 33342 and normalized fluorescence intensity due to EDU incorporation, ALP activity, or Muc2 staining was plotted against the compound number. EDU, ALP, and Muc2 fluorescence signals were normalized by summing the fluorescence intensity and dividing by nuclear percent area (ie, an indicator of cell number). Hits were designated as 6, extremely strong; 5, very strong; 4, strong; 3, fairly strong; 2, moderate; 1, fairly moderate (Moderate and fairly moderate effects were designated only for compounds within the Muc2 screen). †Cultures with extensive cell death (≤10% nuclear coverage). Bars represent the average, and error bar is a single standard deviation. (B) Map of hit compounds. Green and pink indicate an increased or decreased value, respectively, relative to that of the control (ENR-w). Black indicates cultures with extensive cell death. (C) Views of raw fluorescence images from screened primary mouse colonic epithelium. (Left) Full-well composite fluorescence image of primary mouse colonic epithelium in control ENR-w medium. Scale bar = 1 mm. (Right) Fluorescence images of colony regions with “i” marking ALP+ and Muc2+ cells, “ii” marking EDU+ cells, and “iii” denoting Muc2+ cells. Scale bar = 100 μm. (D) Representative fluorescence images from the compound screen. Scale bar = 1 mm.
Figure 7
Figure 7
Assaying a subset of dietary compounds and metabolites on murine 3-D organoids. (A) Percentage of collagen surface area that was positive for Hoechst 33342 and normalized fluorescence intensity due to EDU incorporation, ALP activity, or Muc2 staining was plotted against the compound number. EDU, ALP, and Muc2 fluorescence signals were normalized by summing the fluorescence intensity and dividing by nuclear percent area (ie, an indicator of cell number). Hits were designated as subtypes: 6, extremely strong; 5, very strong; 4, strong; 3, fairly strong; 2, moderate; 1, fairly moderate (Moderate and fairly moderate effects were designated only for compounds within the Muc2 screen). †Cultures with extensive cell death (≤10% nuclear coverage for 2-D or ≤2% nuclear coverage for 3-D). Bars represent the average, and error bar is a single standard deviation. (B) Representative fluorescence images from the assay. Scale bar = 1 mm. (C) (i) and (ii) Comparison of effect of selected compounds on 2-D monolayer and 3-D organoids. Green and pink indicate increased or decreased value, respectively, relative to that of the control (ENR-w). Black indicates cultures with extensive cell death. (iii) Direct comparison of responses of 2-D monolayers and 3-D organoids to the compounds. White indicates strong response by both cultures in same direction (enhanced or diminished effect) or weak response by both cultures. Green-blue indicates strong response in one culture system but not the other. Orange indicates strong responses in both cultures but in opposite directions. Grey indicates that no comparison of the 2 cell types was made.
Figure 8
Figure 8
Impact of 7 dietary compounds and natural products on human primary rectal and tumor Caco-2 cells. (A) SSMD effect size was plotted against the compound number for the 4 screen readouts: percentage of image surface area that was positive for Hoechst 33342 and the normalized fluorescence intensity due to EDU incorporation, ALP activity, or Muc2 staining. EDU, ALP, and Muc2 fluorescence signals were normalized by summing the fluorescence intensity and dividing by nuclear percent area (ie, indicator of cell number). |SSMD| > 1.645 is required to designate a strong effect size. (B and C) Representative fluorescence images from the assays. Control medium for Caco-2 cells was Dulbecco modified Eagle medium. Scale bar = 1 mm.
Supplementary Figure 1
Descending plots showing impact of dietary compounds and natural products on primary mouse colonic epithelium. Percentage of collagen surface area that demonstrated fluorescence due to Hoechst 33342, EDU incorporation, ALP activity, or Muc2 staining was plotted against the compound number indicated on the x-axis. EDU, ALP, and Muc2 areas were normalized to the nuclear area. Compounds were ranked by their SSMD effect sizes, and hits were selected from compounds exceeding SSMD thresholds. Hits were designated as effect subtypes: 6, extremely strong; 5, very strong; 4, strong; 3, fairly strong; 2, moderate; 1, fairly moderate (Moderate and fairly moderate effects were designated only for compounds within the Muc2 screen). †Cultures with extensive cell death (≤10% nuclear coverage); *Control medium; **Control differentiation medium.

Similar articles

Cited by

References

    1. Grossmann J., Walther K., Artinger M. Progress on isolation and short-term ex-vivo culture of highly purified non-apoptotic human intestinal epithelial cells (IEC) Eur J Cell Biol. 2003;82:262–270. - PubMed
    1. Engle M.J., Goetz G.S., Alpers D.H. Caco-2 cells express a combination of colonocyte and enterocyte phenotypes. J Cell Physiol. 1998;174:362–369. - PubMed
    1. Sun H., Chow E.C.Y., Liu S. The Caco-2 cell monolayer: usefulness and limitations. Expert Opin Drug Metab Toxicol. 2008;4:395–411. - PubMed
    1. Ahmad A.A., Wang Y.L., Gracz A.D. Optimization of 3-D organotypic primary colonic cultures for organ-on-chip applications. J Biol Eng. 2014;8:9. - PMC - PubMed
    1. Jung P., Sato T., Merlos-Suarez A. Isolation and in vitro expansion of human colonic stem cells. Nat Med. 2011;17:1225–1227. - PubMed

Supplementary References

    1. Yin X.L., Farin H.F., van Es J.H. Niche-independent high-purity cultures of Lgr5(+) intestinal stem cells and their progeny. Nat Methods. 2014;11:106–112. - PMC - PubMed
    1. Comalada M., Bailon E., de Haro O. The effects of short-chain fatty acids on colon epithelial proliferation and survival depend on the cellular phenotype. J Cancer Res Clin Oncol. 2006;132:487–497. - PubMed
    1. Kaiko G.E., Ryu S.H., Koues O.I. The colonic crypt protects stem cells from microbiota-derived metabolites. Cell. 2016;165:1708–1720. - PMC - PubMed
    1. Ooi C.C., Good N.M., Williams D.B. Structure-activity relationship of butyrate analogues on apoptosis, proliferation and histone deacetylase activity in HCT-116 human colorectal cancer cells. Clin Exp Pharmacol Physiol. 2010;37:905–911. - PubMed
    1. Malago J.J., Koninkx J., Douma P.M. Differential modulation of enterocyte-like Caco-2 cells after exposure to short-chain fatty acids. Food Additives and Contaminants. 2003;20:427–437. - PubMed