

Cross-Laboratory Analysis of Brain Cell Type Transcriptomes with Applications to Interpretation of Bulk Tissue Data
- PMID: 29204516
- PMCID: PMC5707795
- DOI: 10.1523/ENEURO.0212-17.2017
Cross-Laboratory Analysis of Brain Cell Type Transcriptomes with Applications to Interpretation of Bulk Tissue Data
Abstract
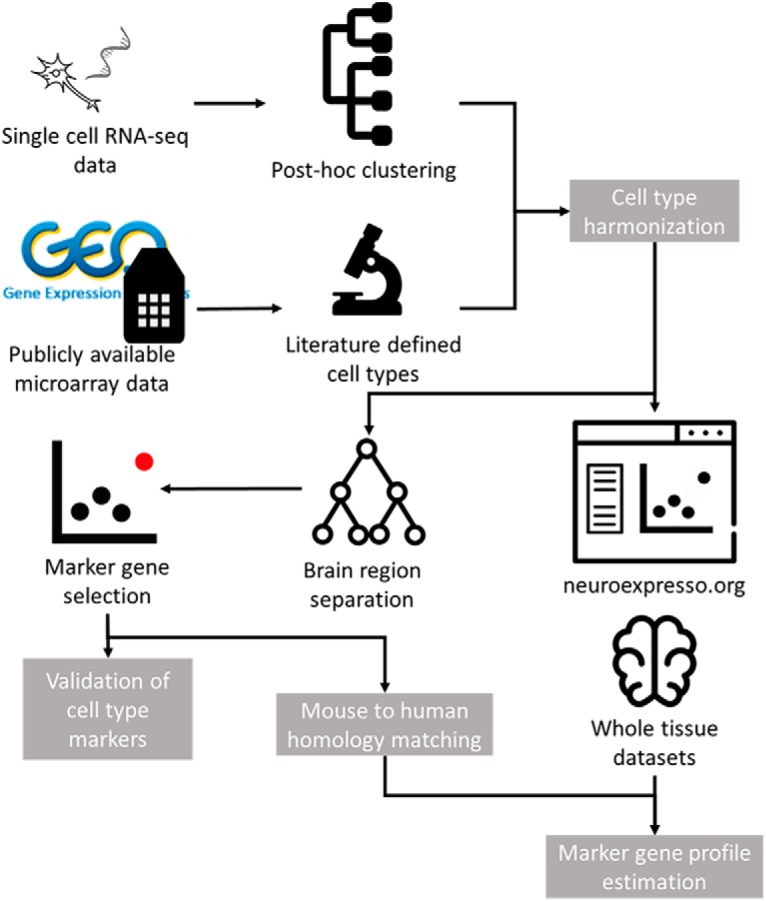
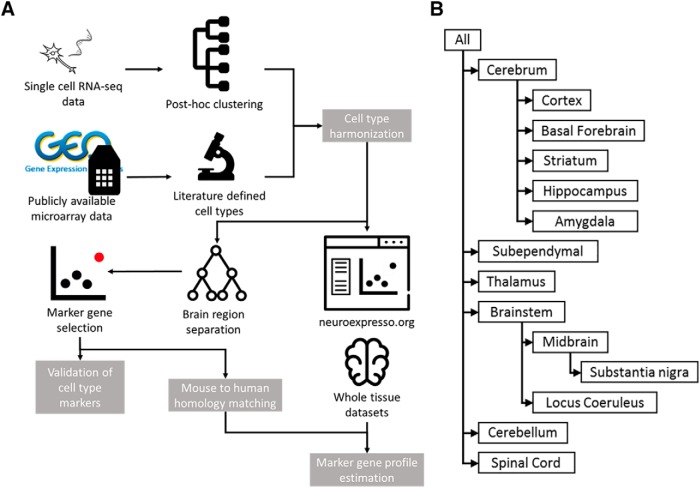
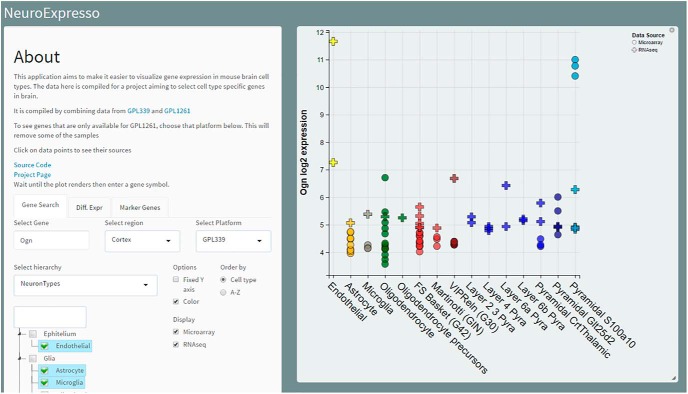
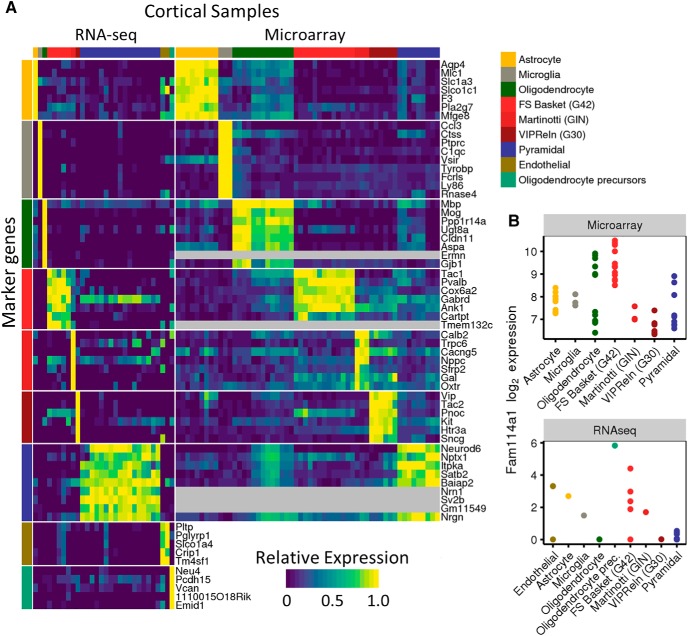
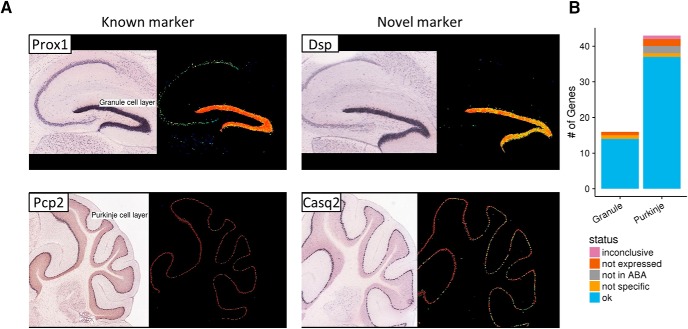
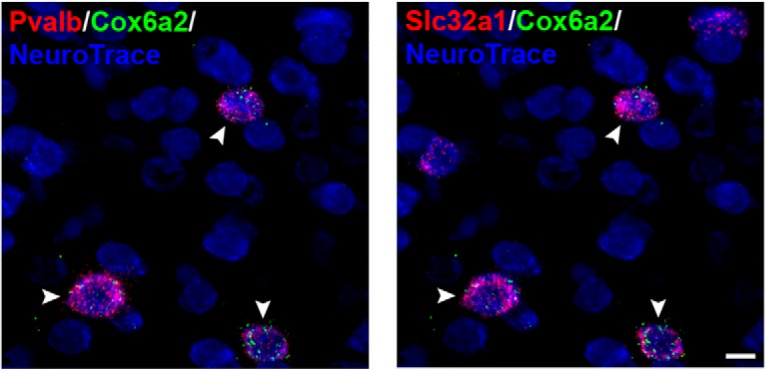
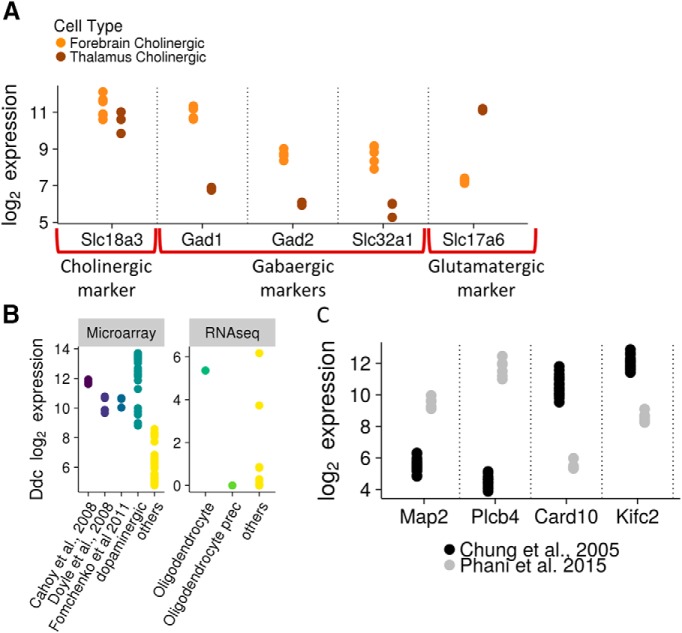
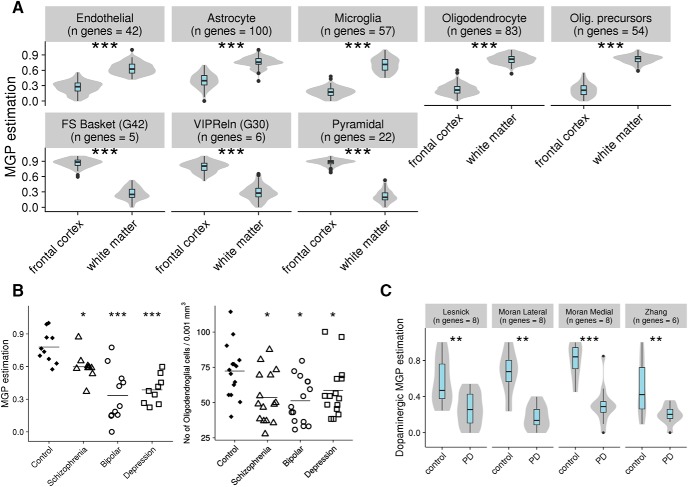
Establishing the molecular diversity of cell types is crucial for the study of the nervous system. We compiled a cross-laboratory database of mouse brain cell type-specific transcriptomes from 36 major cell types from across the mammalian brain using rigorously curated published data from pooled cell type microarray and single-cell RNA-sequencing (RNA-seq) studies. We used these data to identify cell type-specific marker genes, discovering a substantial number of novel markers, many of which we validated using computational and experimental approaches. We further demonstrate that summarized expression of marker gene sets (MGSs) in bulk tissue data can be used to estimate the relative cell type abundance across samples. To facilitate use of this expanding resource, we provide a user-friendly web interface at www.neuroexpresso.org.
Keywords: RNA sequencing; cell type; gene expression; marker gene; microarray.
Figures
Similar articles
-
AgriSeqDB: an online RNA-Seq database for functional studies of agriculturally relevant plant species.BMC Plant Biol. 2018 Sep 19;18(1):200. doi: 10.1186/s12870-018-1406-2. BMC Plant Biol. 2018. PMID: 30231853 Free PMC article.
-
Representation and relative abundance of cell-type selective markers in whole-kidney RNA-Seq data.Kidney Int. 2019 Apr;95(4):787-796. doi: 10.1016/j.kint.2018.11.028. Epub 2019 Feb 27. Kidney Int. 2019. PMID: 30826016 Free PMC article.
-
Investigating transcriptome-wide sex dimorphism by multi-level analysis of single-cell RNA sequencing data in ten mouse cell types.Biol Sex Differ. 2020 Nov 5;11(1):61. doi: 10.1186/s13293-020-00335-2. Biol Sex Differ. 2020. PMID: 33153500 Free PMC article.
-
Brain Transcriptome Databases: A User's Guide.J Neurosci. 2018 Mar 7;38(10):2399-2412. doi: 10.1523/JNEUROSCI.1930-17.2018. Epub 2018 Feb 7. J Neurosci. 2018. PMID: 29437890 Free PMC article. Review.
-
Getting the most out of parasitic helminth transcriptomes using HelmDB: implications for biology and biotechnology.Biotechnol Adv. 2013 Dec;31(8):1109-19. doi: 10.1016/j.biotechadv.2012.12.004. Epub 2012 Dec 21. Biotechnol Adv. 2013. PMID: 23266393 Review.
Cited by
-
Complex IV subunit isoform COX6A2 protects fast-spiking interneurons from oxidative stress and supports their function.EMBO J. 2020 Sep 15;39(18):e105759. doi: 10.15252/embj.2020105759. Epub 2020 Aug 3. EMBO J. 2020. PMID: 32744742 Free PMC article.
-
Transcriptional profiling of microglia; current state of the art and future perspectives.Glia. 2020 Apr;68(4):740-755. doi: 10.1002/glia.23767. Epub 2019 Dec 17. Glia. 2020. PMID: 31846124 Free PMC article. Review.
-
NAAA-regulated lipid signaling governs the transition from acute to chronic pain.Sci Adv. 2021 Oct 22;7(43):eabi8834. doi: 10.1126/sciadv.abi8834. Epub 2021 Oct 22. Sci Adv. 2021. PMID: 34678057 Free PMC article.
-
A Transcriptomic Signature of Depressive Symptoms in Late Life.Biol Psychiatry Glob Open Sci. 2025 Jan 9;5(3):100448. doi: 10.1016/j.bpsgos.2025.100448. eCollection 2025 May. Biol Psychiatry Glob Open Sci. 2025. PMID: 40094036 Free PMC article.
-
Environmental Enrichment Induces Epigenomic and Genome Organization Changes Relevant for Cognition.Front Mol Neurosci. 2021 May 5;14:664912. doi: 10.3389/fnmol.2021.664912. eCollection 2021. Front Mol Neurosci. 2021. PMID: 34025350 Free PMC article.
References
-
- Anandasabapathy N, Victora GD, Meredith M, Feder R, Dong B, Kluger C, Yao K, Dustin ML, Nussenzweig MC, Steinman RM, Liu K (2011) Flt3L controls the development of radiosensitive dendritic cells in the meninges and choroid plexus of the steady-state mouse brain. J Exp Med 208:1695–1705. 10.1084/jem.20102657 - DOI - PMC - PubMed
-
- Barrett T, Wilhite SE, Ledoux P, Evangelista C, Kim IF, Tomashevsky M, Marshall KA, Phillippy KH, Sherman PM, Holko M, Yefanov A, Lee H, Zhang N, Robertson CL, Serova N, Davis S, Soboleva A (2013) NCBI GEO: archive for functional genomics data sets—update. Nucleic Acids Res 41:D991–D995. - PMC - PubMed
-
- Beckervordersandforth R, Tripathi P, Ninkovic J, Bayam E, Lepier A, Stempfhuber B, Kirchhoff F, Hirrlinger J, Haslinger A, Lie DC, Beckers J, Yoder B, Irmler M, Götz M (2010) In vivo fate mapping and expression analysis reveals molecular hallmarks of prospectively isolated adult neural stem cells. Cell Stem Cell 7:744–758. 10.1016/j.stem.2010.11.017 - DOI - PubMed
-
- Benjamini Y, Hochberg Y (1995) Controlling the false discovery rate: a practical and powerful approach to multiple testing. J R Stat Soc Ser B Methodol 57:289–300.
MeSH terms
Grants and funding
LinkOut - more resources
Full Text Sources
Other Literature Sources