. 2018 Mar;67(3):445-457.
doi: 10.1007/s00262-017-2095-7. Epub 2017 Dec 4.

Combination of mAb-AR20.5, anti-PD-L1 and PolyICLC inhibits tumor progression and prolongs survival of MUC1.Tg mice challenged with pancreatic tumors

Affiliations

Combination of mAb-AR20.5, anti-PD-L1 and PolyICLC inhibits tumor progression and prolongs survival of MUC1.Tg mice challenged with pancreatic tumors

Kamiya Mehla et al. Cancer Immunol Immunother. 2018 Mar.

Abstract

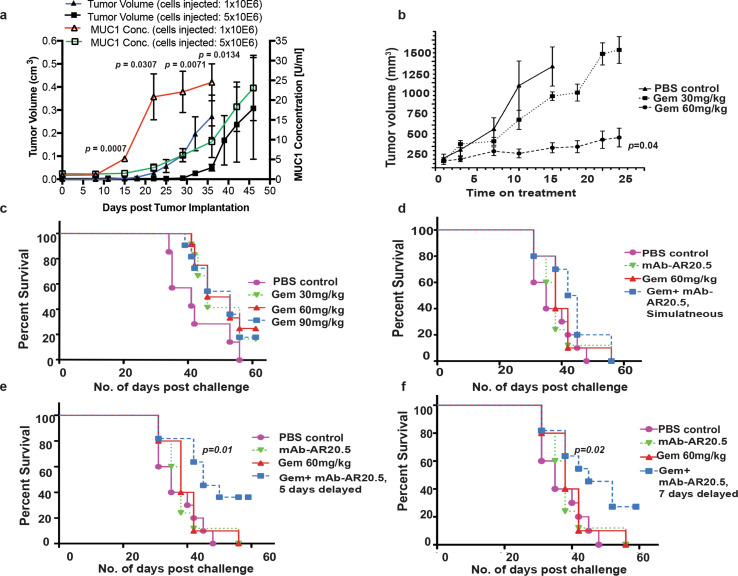
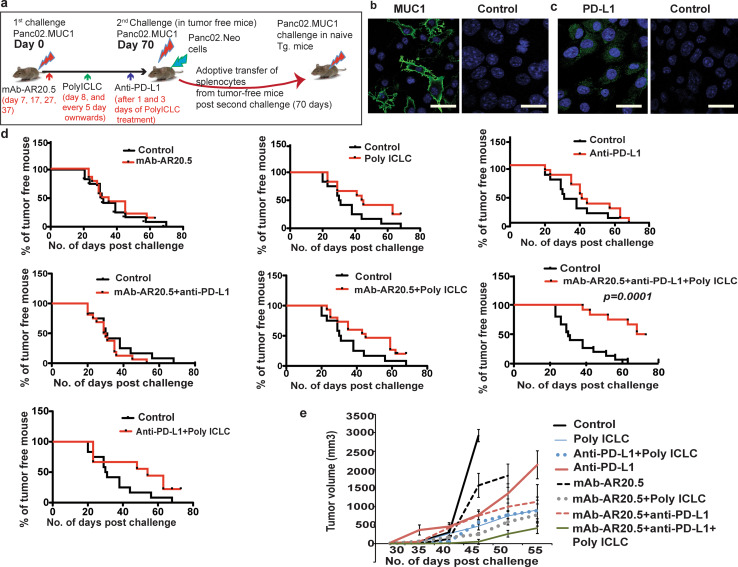
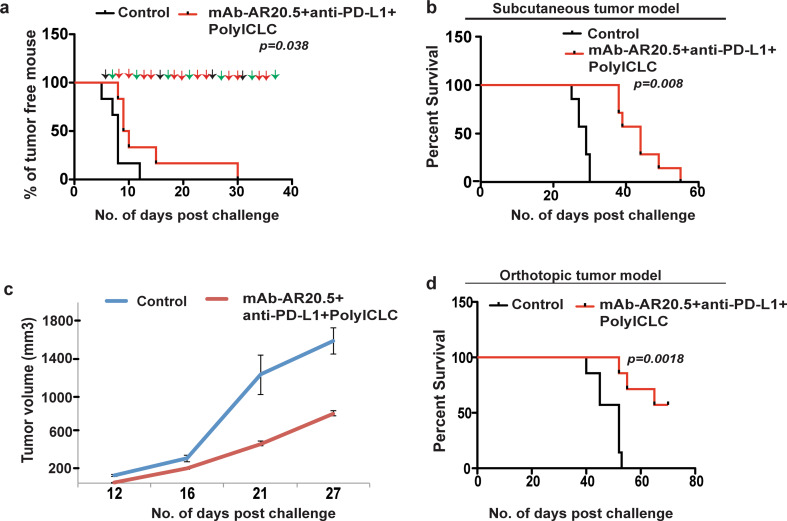
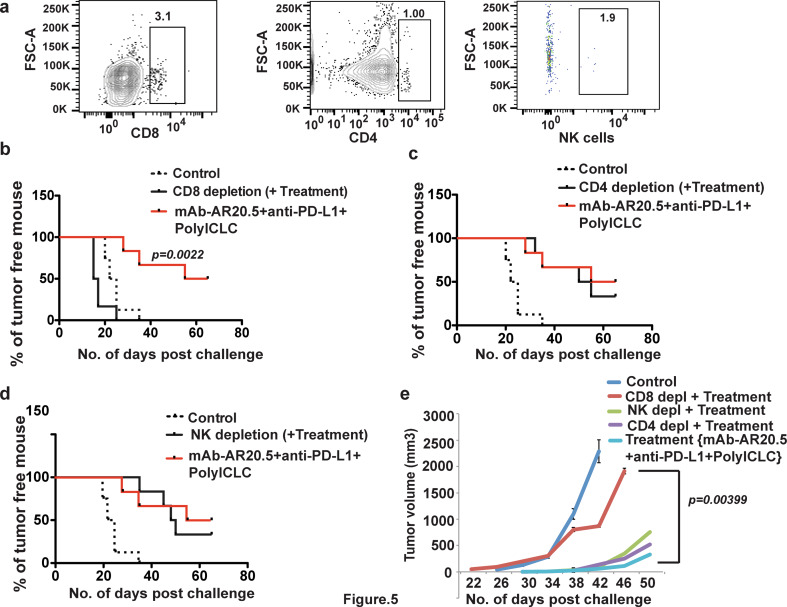
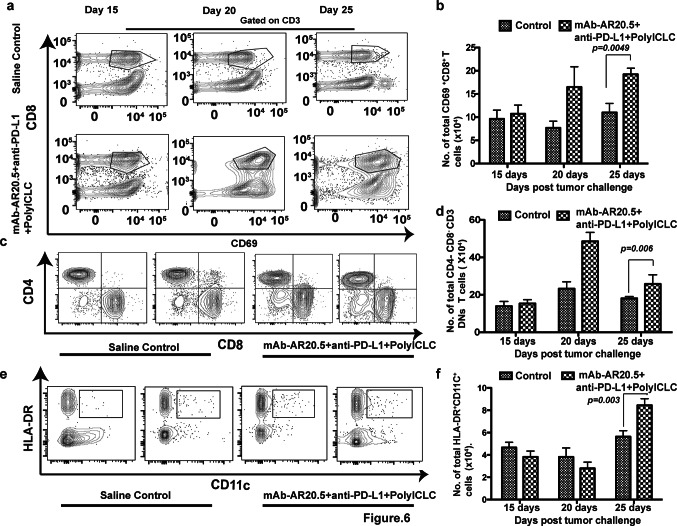
A substantial body of evidence suggests the existence of MUC1-specific antibodies and cytotoxic T cell activities in pancreatic cancer patients. However, tumor-induced immunosuppression renders these responses ineffective. The current study explores a novel therapeutic combination wherein tumor-bearing hosts can be immunologically primed with their own antigen, through opsonization with a tumor antigen-targeted antibody, mAb-AR20.5. We evaluated the efficacy of immunization with this antibody in combination with PolyICLC and anti-PD-L1. The therapeutic combination of mAb-AR20.5 + anti-PD-L1 + PolyICLC induced rejection of human MUC1 expressing tumors and provided a long-lasting, MUC1-specific cellular immune response, which could be adoptively transferred and shown to provide protection against tumor challenge in human MUC1 transgenic (MUC.Tg) mice. Furthermore, antibody depletion studies revealed that CD8 cells were effectors for the MUC1-specific immune response generated by the mAb-AR20.5 + anti-PD-L1 + PolyICLC combination. Multichromatic flow cytometry data analysis demonstrated a significant increase over time in circulating, activated CD8 T cells, CD3+CD4-CD8-(DN) T cells, and mature dendritic cells in mAb-AR20.5 + anti-PD-L1 + PolyICLC combination-treated, tumor-bearing mice, as compared to saline-treated control counterparts. Our study provides a proof of principle that an effective and long-lasting anti-tumor cellular immunity can be achieved in pancreatic tumor-bearing hosts against their own antigen (MUC1), which can be further potentiated using a vaccine adjuvant and an immune checkpoint inhibitor.

Keywords: Anti-PD-L1; CD8 T cells; MUC1; Pancreatic cancer; PolyICLC; mAb-AR20.5 antibody.


Conflict of interest statement

The authors have no conflict of interest.

Figures

Fig. 1
Fig. 1
mAb-AR20.5 in combination with gemcitabine prolongs survival of Panc02.MUC1 tumor-bearing MUC1.Tg mice. a Representative plot showing circulating levels of human MUC1 and corresponding tumor volumes in MUC1.Tg mice post-orthotopic implantation of Panc02.MUC1 tumor cells. Circulating MUC1 levels above normal were detected as early as 15–21 days post-tumor cell implantation by ELISA (n = 3 for each group). The MUC1 levels were compared between the two groups by performing a two-sample t test for each time point. b Dose dependent effect of gemcitabine on the growth of Panc02.MUC1 tumor in MUC1.Tg mice. Gemcitabine at 60 mg/kg significantly reduced tumor growth over time, (n = 3/gp; p = 0.04). c Kaplan–Meier plots show dose-dependent effects of gemcitabine on overall survival of Panc02.MUC1 tumor-bearing MUC1.Tg mice. Statistically significant differences in survival were observed for tumor-bearing MUC1.Tg mice treated with 60 mg/kg gemcitabine compared to PBS treated mice (p = 0.05). df Kaplan–Meier plots showing survival curves for tumor-bearing MUC1.Tg mice post-treatment with PBS (i.p), mAb-AR20.5 (i.p) and gemcitabine (i.p) or combination of mAb-AR20.5 and gemcitabine using different schedules of treatment. For combination treatment, mAb-AR20.5 was injected on the same day (d), 5 days post (p = 0.01; combination vs. PBS) (e), or 7 days post (p = 0.02; combination vs. PBS, log-rank test) (f) second dose of gemcitabine injection. Representative of experiments repeated twice (n = 10/gp). The mixed effects model with random mice effects was used to compare the tumor growth over time between groups after accounting for the correlation among the measurements on the same mice
Fig. 2
Fig. 2
mAb-AR20.5 in combination with anti-PD-L1 and PolyICLC induces rejection of Panc02.MUC1 tumors in MUC1.Tg mice. a Diagrammatic representation of in vivo experimental design for subcutaneous pancreatic tumor challenge in MUC1.Tg mice. b, c Representative images show immunofluorescence staining for human MUC1 (green), nucleus (blue) (b) and PD-L1 (green) (c) in Panc02.MUC1 tumor cells. d Time-to-tumor progression for different combination treatment groups receiving mAb-AR20.5, anti-PD-L1 and PolyICLC in MUC1.Tg mice. e Tumor growth curves for mice treated with different combinations of mAb-AR20.5, anti-PD-L1 and PolyICLC post Panc02.MUC1 tumor cell implantation in MUC1.Tg mice. The results shown are representative of three independent studies, p = 0.0001; mAb-AR20.5 based combination vs. saline control. Representative experiments were repeated thrice, (n = 6/gp), p = 0.0001; mAb-AR20.5 based combination vs. saline control, log-rank test (TTP curves). The mixed effects model with random mice effects was used to compare the tumor growth over time between groups after accounting for the correlation among the measurements on the same mice
Fig. 3
Fig. 3
mAb-AR20.5 + anti-PD-L1 + PolyICLC combination-treated mice display MUC1 specific immunity and reject rechallenged Panc02.MUC1 tumors in MUC1.Tg mice. a Time-to-tumor progression curves following rechallenge with Panc02.Neo or Panc02.MUC1 tumors for control or mice that rejected Panc02.MUC1 tumors following treatment with mAb-AR20.5 + anti-PD-L1 + PolyICLC. b Tumor growth curves for Panc02.Neo and Panc02.MUC1 tumors for control or mAb-AR20.5 + anti-PD-L1 + PolyICLC-treated mice post second round of tumor cell challenge (p = 0.0001). c Representative plot showing proliferation of splenocytes as determined by CFSE-based proliferation assay of spleen cells from saline-treated control and combination-treated MUC1.Tg mice that had rejected tumors. The red peak shows mean fluorescence intensity (MFI) for CFSE-labeled splenocytes on day “0” while the blue peak shows MFI for CFSE-labeled splenocytes on day 4-post stimulation with PMA and ionomycin. d Representative plot showing time-to-tumor progression for Panc02.MUC1 tumors in control (no cells) and immune cell recipient mice, following adoptive transfer of immune cells from animals that previously rejected Panc02.MUC1 tumors. Rechallenge experiments were repeated thrice (n = 3–4/gp). Adoptive transfer experiments were repeated twice (3 recipient mice/1 donor mice splenocytes, n = 6/gp), log-rank test (TTP curves). The mixed effects model with random mice effects was used to compare the tumor growth over time between groups after accounting for the correlation among the measurements on the same mice
Fig. 4
Fig. 4
mAb-AR20.5 + anti-PD-L1 + PolyICLC combination treatment restrains tumor growth in KPC.MUCI tumor-bearing Tg mice. a Time-to-tumor progression curve for saline control and mAb-AR20.5 + Anti-PD-L1 + PolyICLC treated KPC.MUC1 tumor-bearing MUC1.Tg mice. Black, green and red arrows represent time of therapeutic intervention with mAb-AR20.5, PolyICLC and anti-PD-L1, respectively. b, c Kaplan–Meier survival curves (b), tumor growth curves (c) for saline and mAb-AR20.5 + anti-PD-L1 + PolyICLC treated MUC1.Tg mice (subcutaneous tumor challenge, p value was not statistically significant for tumor growth curves). The results shown are representative of 2 independent experiments (n = 6/gp). d Kaplan–Meier survival curves for different treatment post-orthotopic tumor (KPC.MUC1) implantation in MUC1.Tg mice (n = 8/gp, log-rank test for TTP and survival curves)
Fig. 5
Fig. 5
CD8 T cells are effectors of anti-tumor responses following mAb-AR20.5 + anti-PD-L1 + PolyICLC combination in MUC1 tumor-bearing transgenic mice. a Representative FACS plots showing CD8, CD4 and NK cell depletion in MUC1.Tg mice spleen. bd Time-to-tumor progression (Panc02.MUC1 tumor challenge) curves for animals treated with PBS alone (control), or mAb-AR20.5 + anti-PD-L1 + PolyICLC-treated with or without CD8-depletion (b), CD4-depletion (c), or NK cells-depletion (d). e Tumor growth curves for mice treated with saline, mAb-AR20.5, anti-PD-L1 and PolyICLC or the indicated groups of immune cell-depleted MUC1.Tg mice. Depletion experiments were performed once, (n = 6/gp), log-rank test (for TTP curves). The mixed effects model with random mice effects was used to compare the tumor growth over time between groups after accounting for the correlation among the measurements on the same mice
Fig. 6
Fig. 6
mAb-AR20.5 + anti-PD-L1 + PolyICLC-treated mice display high numbers of circulating activated CD8, CD3+DN T cell and mature dendritic cells (CD11c+ HLA-DR+). a Representative FACS plots for activated CD8 T cells at different days post-treatment with saline or mAb-AR20.5 + anti-PD-L1 + PolyICLC for Panc02.MUC1 tumor-bearing mice. b Histogram plot shows the frequency of activated CD8 T cells (p = 0.049) in circulation at indicated days post-treatment with saline or mAb-AR20.5 + anti-PD-L1 + PolyICLC. c, e Representative FACS plots for CD3+DN (gated on CD3, CD69) T cells (c) and mature dendritic cells (gated on CD11b population) (e) for two mice at day 25 in the indicated treatment groups. d, f representative histogram plot show the frequency CD3+DN T cells (p = 0.006) (d), and mature dendritic cells (p = 0.003) (f), in the circulation at different days post-treatment with saline or mAb-AR20.5 + anti-PD-L1 + PolyICLC. (n = 5/gp), two-way ANOVA using the Bonferroni correction for multiple comparison

Similar articles

Cited by

References

    1. Kotera Y, Fontenot JD, Pecher G, Metzgar RS, Finn OJ. Humoral immunity against a tandem repeat epitope of human mucin MUC-1 in sera from breast, pancreatic, and colon cancer patients. Cancer Res. 1994;54:2856–2860. - PubMed
    1. Barnd DL, Lan MS, Metzgar RS, Finn OJ. Specific, major histocompatibility complex-unrestricted recognition of tumor-associated mucins by human cytotoxic T cells. PNAS. 1989;86:7159–7163. doi: 10.1073/pnas.86.18.7159. - DOI - PMC - PubMed
    1. Heller A, Zornig I, Muller T, et al. Immunogenicity of SEREX-identified antigens and disease outcome in pancreatic cancer. Cancer Immunol Immunother. 2010;59:1389–1400. doi: 10.1007/s00262-010-0870-9. - DOI - PMC - PubMed
    1. Le DT, Wang-Gillman A, Picozzi V, Greten TF, et al. Saftey and survival with GVAX pancreas prime and Listeria Monocytogenes-expressing mesothelin (CRS-207) boost vaccines for metastatic pancreatic cancer. J Clin Oncol. 2015;33:1325–1333. doi: 10.1200/JCO.2014.57.4244. - DOI - PMC - PubMed
    1. Beatty GL, Chiorean EG, Fishman MP, et al. CD40 agonists alter tumor stroma and show efficacy against pancreatic carcinoma in mice and humans. Science. 2011;331:1612–1616. doi: 10.1126/science.1198443. - DOI - PMC - PubMed

MeSH terms