

Lexical-Access Ability and Cognitive Predictors of Speech Recognition in Noise in Adult Cochlear Implant Users
- PMID: 29205095
- PMCID: PMC5721962
- DOI: 10.1177/2331216517743887
Lexical-Access Ability and Cognitive Predictors of Speech Recognition in Noise in Adult Cochlear Implant Users
Abstract
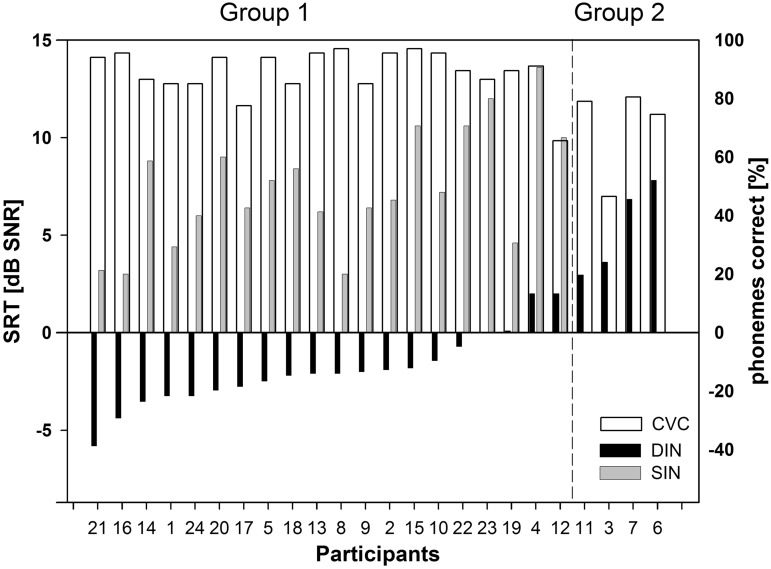
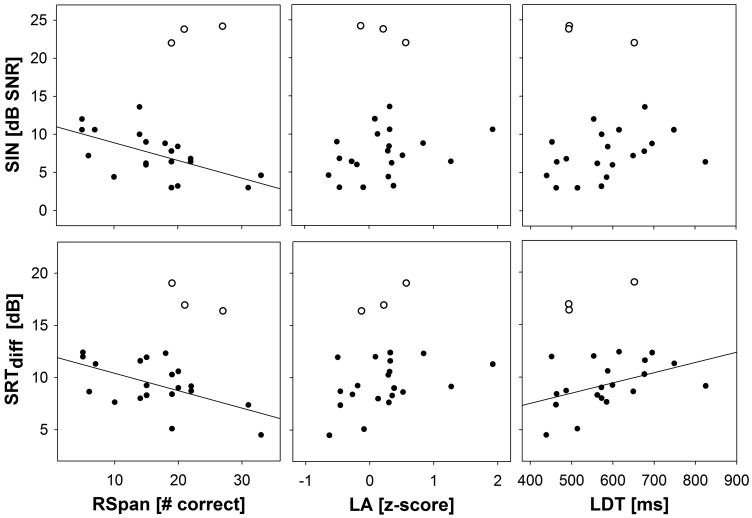
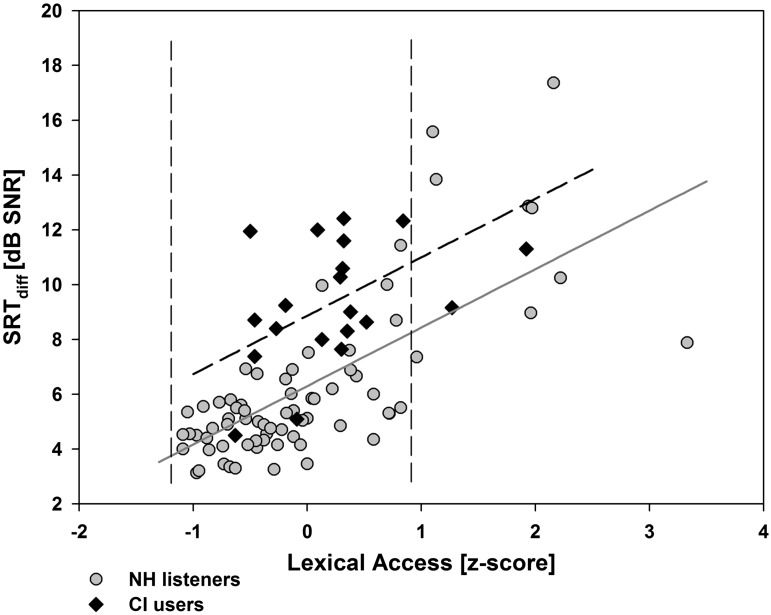
Not all of the variance in speech-recognition performance of cochlear implant (CI) users can be explained by biographic and auditory factors. In normal-hearing listeners, linguistic and cognitive factors determine most of speech-in-noise performance. The current study explored specifically the influence of visually measured lexical-access ability compared with other cognitive factors on speech recognition of 24 postlingually deafened CI users. Speech-recognition performance was measured with monosyllables in quiet (consonant-vowel-consonant [CVC]), sentences-in-noise (SIN), and digit-triplets in noise (DIN). In addition to a composite variable of lexical-access ability (LA), measured with a lexical-decision test (LDT) and word-naming task, vocabulary size, working-memory capacity (Reading Span test [RSpan]), and a visual analogue of the SIN test (text reception threshold test) were measured. The DIN test was used to correct for auditory factors in SIN thresholds by taking the difference between SIN and DIN: SRTdiff. Correlation analyses revealed that duration of hearing loss (dHL) was related to SIN thresholds. Better working-memory capacity was related to SIN and SRTdiff scores. LDT reaction time was positively correlated with SRTdiff scores. No significant relationships were found for CVC or DIN scores with the predictor variables. Regression analyses showed that together with dHL, RSpan explained 55% of the variance in SIN thresholds. When controlling for auditory performance, LA, LDT, and RSpan separately explained, together with dHL, respectively 37%, 36%, and 46% of the variance in SRTdiff outcome. The results suggest that poor verbal working-memory capacity and to a lesser extent poor lexical-access ability limit speech-recognition ability in listeners with a CI.
Keywords: cochlear implants; lexical access; linguistic skills; speech-in-noise recognition; working memory.
Figures
Similar articles
-
Assessing speech recognition abilities with digits in noise in cochlear implant and hearing aid users.Int J Audiol. 2015 Jan;54(1):48-57. doi: 10.3109/14992027.2014.945623. Epub 2014 Aug 26. Int J Audiol. 2015. PMID: 25156097
-
Neural Correlates of Individual Differences in Speech-in-Noise Performance in a Large Cohort of Cochlear Implant Users.Ear Hear. 2023 Sep-Oct 01;44(5):1107-1120. doi: 10.1097/AUD.0000000000001357. Epub 2023 May 5. Ear Hear. 2023. PMID: 37144890 Free PMC article.
-
On the relationship between auditory cognition and speech intelligibility in cochlear implant users: An ERP study.Neuropsychologia. 2016 Jul 1;87:169-181. doi: 10.1016/j.neuropsychologia.2016.05.019. Epub 2016 May 19. Neuropsychologia. 2016. PMID: 27212057
-
How linguistic closure and verbal working memory relate to speech recognition in noise--a review.Trends Amplif. 2013 Jun;17(2):75-93. doi: 10.1177/1084713813495459. Epub 2013 Aug 13. Trends Amplif. 2013. PMID: 23945955 Free PMC article. Review.
-
The Association Between Cognitive Performance and Speech-in-Noise Perception for Adult Listeners: A Systematic Literature Review and Meta-Analysis.Trends Hear. 2017 Jan-Dec;21:2331216517744675. doi: 10.1177/2331216517744675. Trends Hear. 2017. PMID: 29237334 Free PMC article.
Cited by
-
Speech Recognition and Listening Effort in Cochlear Implant Recipients and Normal-Hearing Listeners.Front Neurosci. 2022 Feb 10;15:725412. doi: 10.3389/fnins.2021.725412. eCollection 2021. Front Neurosci. 2022. PMID: 35221883 Free PMC article.
-
A Scoping Review and Meta-Analysis of the Relations Between Cognition and Cochlear Implant Outcomes and the Effect of Quiet Versus Noise Testing Conditions.Ear Hear. 2024 Nov-Dec 01;45(6):1339-1352. doi: 10.1097/AUD.0000000000001527. Epub 2024 Jul 1. Ear Hear. 2024. PMID: 38953851 Free PMC article.
-
Correlation between Speech Perception Outcomes after Cochlear Implantation and Postoperative Acoustic and Electric Hearing Thresholds.J Clin Med. 2021 Jan 17;10(2):324. doi: 10.3390/jcm10020324. J Clin Med. 2021. PMID: 33477270 Free PMC article.
-
Underlying dimensions of real-time word recognition in cochlear implant users.Nat Commun. 2024 Aug 29;15(1):7382. doi: 10.1038/s41467-024-51514-3. Nat Commun. 2024. PMID: 39209837 Free PMC article.
-
Home-Based Speech Perception Monitoring for Clinical Use With Cochlear Implant Users.Front Neurosci. 2021 Nov 30;15:773427. doi: 10.3389/fnins.2021.773427. eCollection 2021. Front Neurosci. 2021. PMID: 34916902 Free PMC article.
References
-
- Akeroyd M. A. (2008) Are individual differences in speech reception related to individual differences in cognitive ability? A survey of twenty experimental studies with normal and hearing-impaired adults. International Journal of Audiology 47(Suppl 2): S53–S71. doi:10.1080/14992020802301142. - DOI - PubMed
-
- ANSI S3.5-1997 (1997) Methods for the calculation of the speech intelligibility index vol. 19, New York, NY: American National Standards Institute, pp. 90–119.
-
- Baayen H., Piepenbrock R., Van Rijn H. (1993) The CELEX lexical data base CD-ROM, Philadelphia, PA: University of Pennsylvania, Linguistic Data Consortium.
-
- Baskent D., Clarke J., Pals C., Benard M. R., Bhargava P., Saija J., Gaudrain E. (2016) Cognitive compensation of speech perception with hearing impairment, cochlear implants, and aging: How and to what degree can it be achieved? Trends in Hearing 20: 1–16. doi:10.1177/2331216516670279. - DOI
MeSH terms
LinkOut - more resources
Full Text Sources
Other Literature Sources
Medical
