

Review
doi: 10.1088/1478-3975/aa9f34.
Roadmap on semiconductor-cell biointerfaces
Affiliations
- PMID: 29205173
- PMCID: PMC6599646
- DOI: 10.1088/1478-3975/aa9f34
Item in Clipboard
Review
Roadmap on semiconductor-cell biointerfaces
Phys Biol.
.
Abstract
This roadmap outlines the role semiconductor-based materials play in understanding the complex biophysical dynamics at multiple length scales, as well as the design and implementation of next-generation electronic, optoelectronic, and mechanical devices for biointerfaces. The roadmap emphasizes the advantages of semiconductor building blocks in interfacing, monitoring, and manipulating the activity of biological components, and discusses the possibility of using active semiconductor-cell interfaces for discovering new signaling processes in the biological world.
Figures
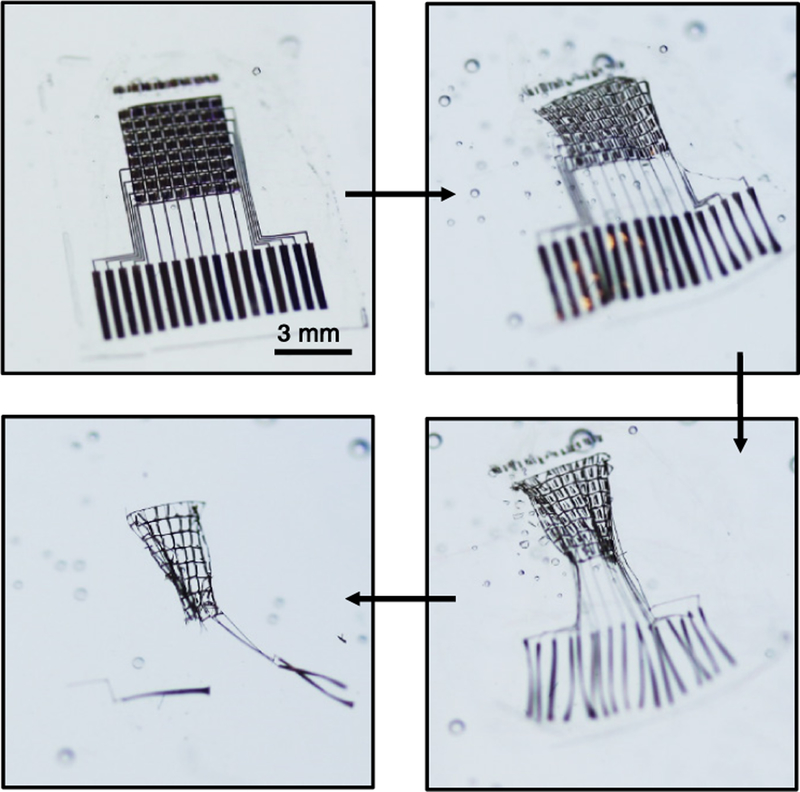
Transient, biodegradable electronic system designed for high-resolution electrophysiological mapping of activity on the surface of the brain, i.e. ECoG. These images show a time sequence corresponding to accelerated dissolution in an aqueous environment. Reprinted from [6] with permission from Macmillan Publishers Ltd: Nature Materials, copyright 2016.
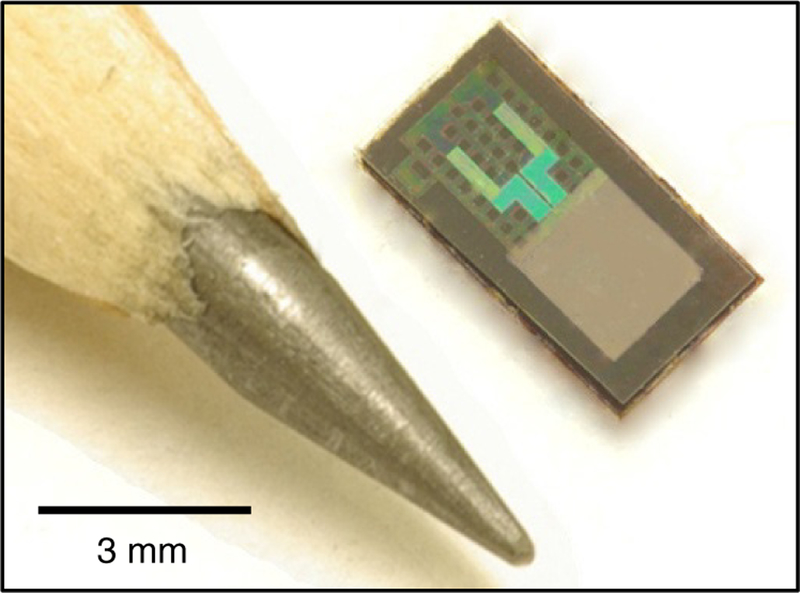
Image of a transient micro-electromechanical system designed for intracranial pressure monitoring (upper right). The pencil tip (lower left) provides a size comparison. Reprinted from [7] with permission from Macmillan Publishers Ltd: Nature, copyright 2016.
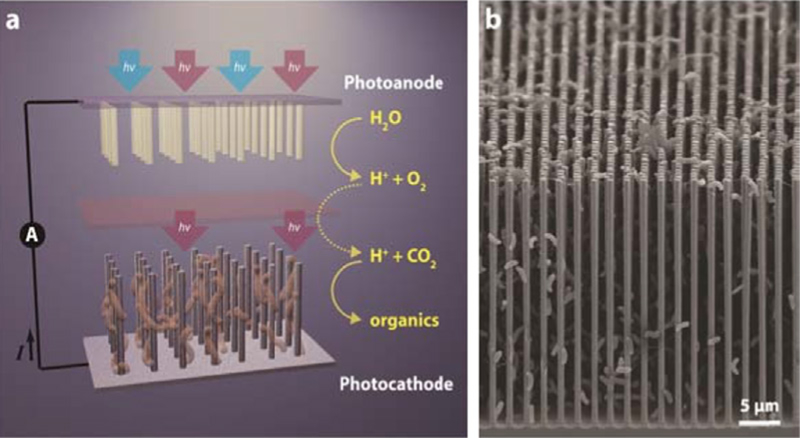
(a) Schematic of a nanowire photoelectrochemical cell loaded with S. ovata for CO2 reduction. (a) SEM image of synergistic nanowire-bacteria network [15]. Reproduced with permission. Copyright 2015 American Chemical Society.
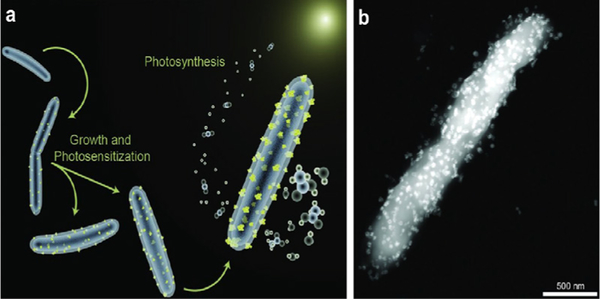
(a) Schematic of the M. thermoacetica–CdS construct including early growth stage, CdS nanoparticle precipitation (yellow) and CO2 reduction through photosynthesis. (b) STEM image of M. thermoacetica–CdS hybrid [18]. Reproduced with permission. Copyright 2016 The American Association for the Advancement of Science.
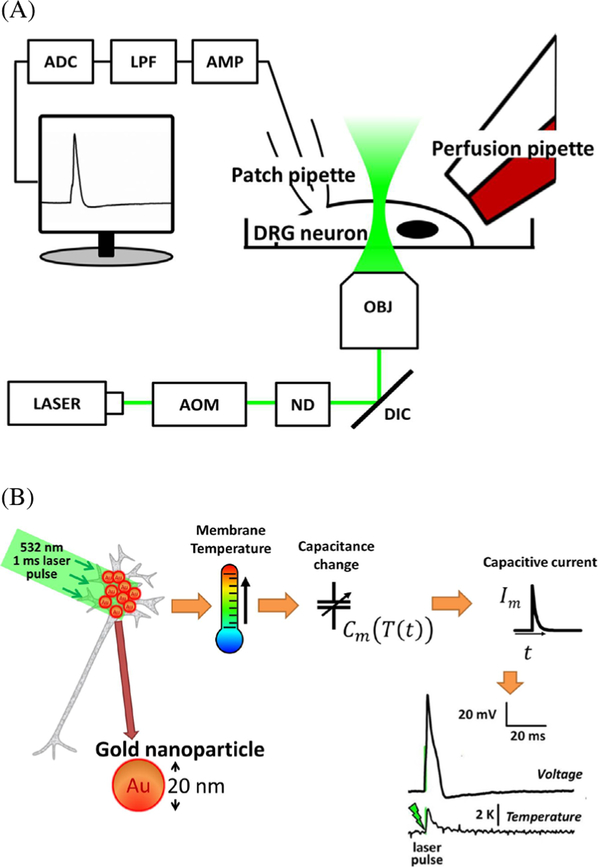
(A) Experimental setup for using optocapacitance technique to stimulate single cells. (B) General optocapacitive mechanism whereby the rate of capacitance change determines the amount of depolarization (Reprinted from [23], copyright 2015, with permission from Elsevier).
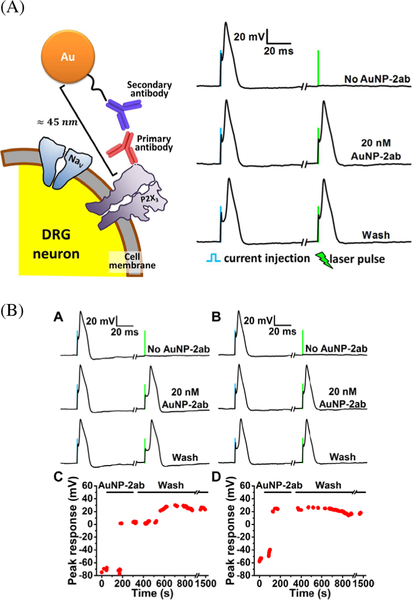
(A) left, AuNP bound to a DRG neuron to stably make the cells photosensitive for optocapacitance stimulation; right, representative traces recorded from DRG neurons labelled with primary antibodies against P2X3 receptors before and after AuNPs attachments using secondary antibodies. (B) Representative traces and peak responses over a period of time from DRG neurons from neurons labeled with primary antibodies against TRPV1 (A and C) and P2X3 (B and D) receptors respectively. In both cases DRG neurons labelled with AuNPs functionalized with secondary antibodies become stably photosensitive. Reprinted from [23], copyright 2015, with permission from Elsevier.
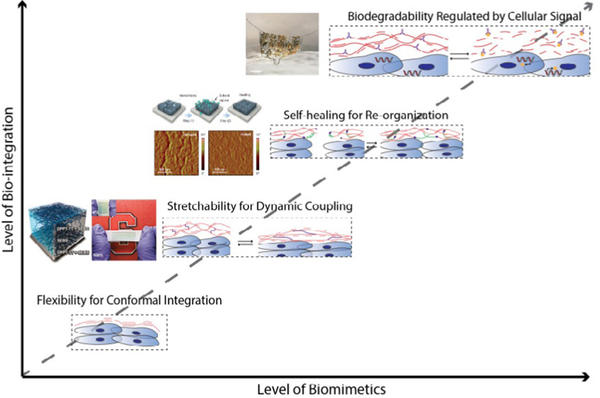
Roadmap of incorporation of physicochemical biomimetic components into polymer electronics for cell interfacing. Blue: cells, red: conjugated polymer electronic materials, purple: crosslinker and dynamic bonds, yellow: biomarkers.
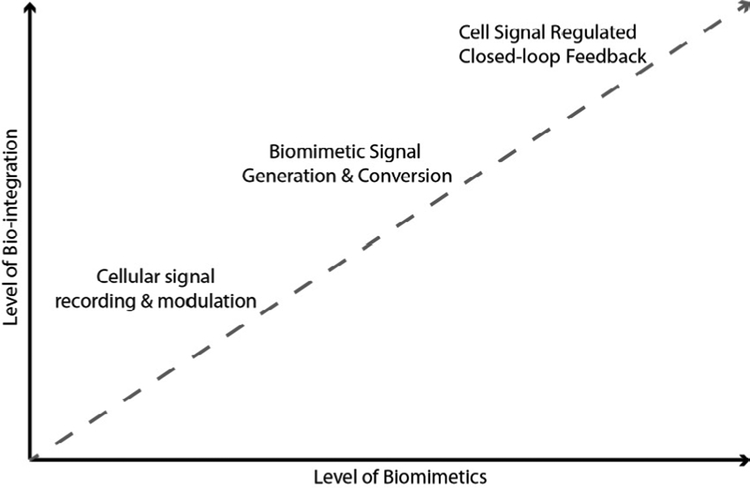
Roadmap of development and incorporation of advanced biomimetic signaling and computational components into polymer electronics for cell interfacing.
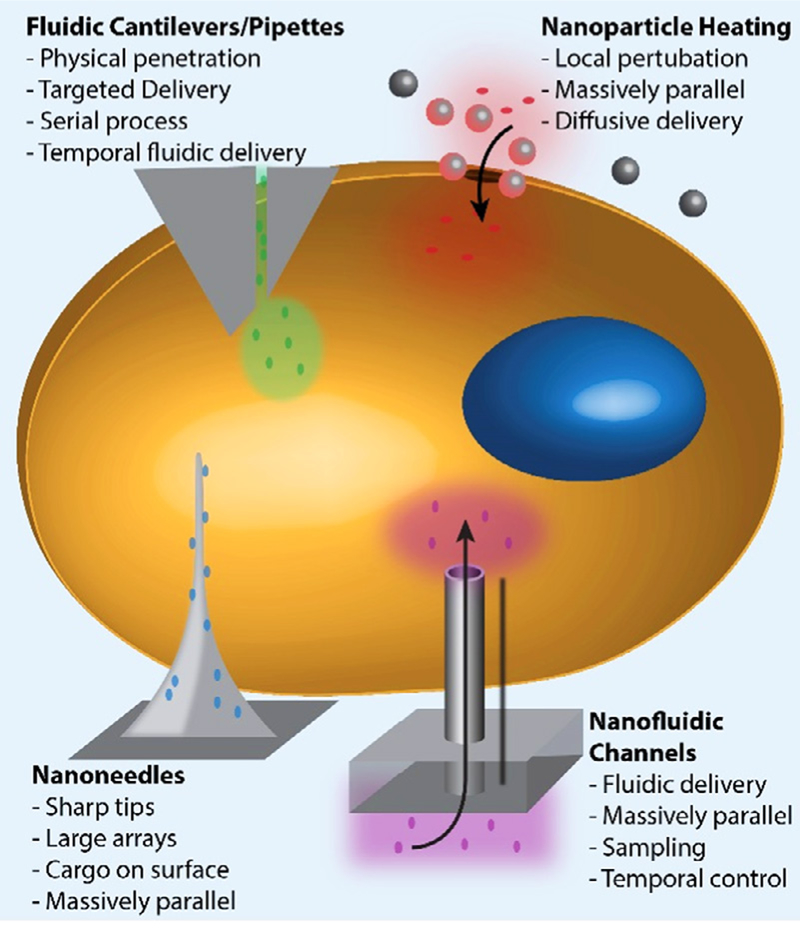
Engineered devices for cellular delivery.
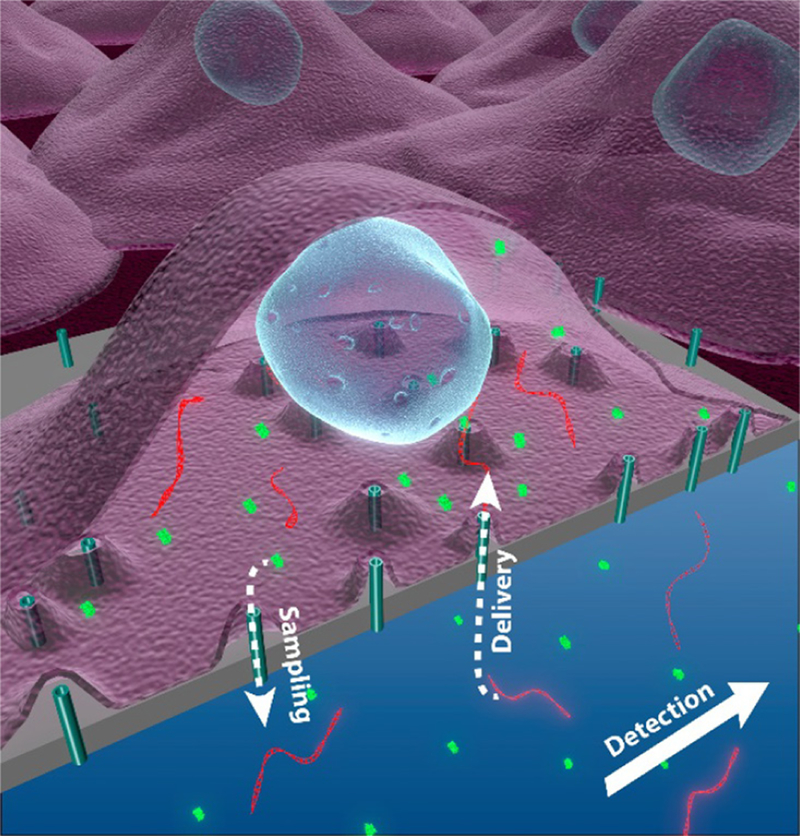
A vision for a two-way nano-fluidic communication system with living cells. Nanoconduits allow both delivery and sampling between the cell and the fluidic chamber.
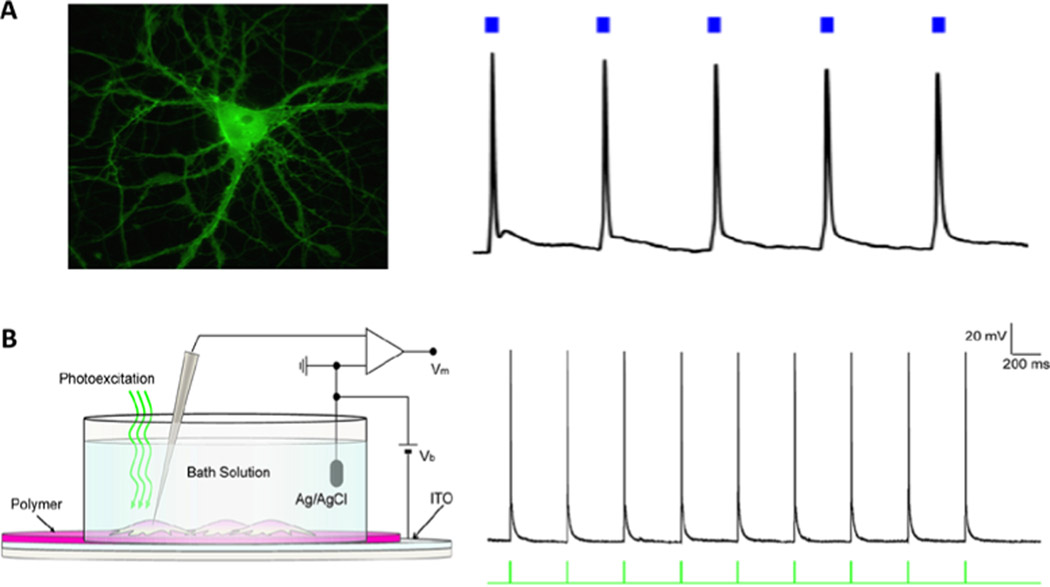
Comparison between neuronal excitation by optogenetics (ChR2; A) and by seamless contact with photosensitive conjugated polymers (P3HT; B). Figure 11B © 2017 Macmillan Publishers Limited, part of Springer Nature. All rights reserved.
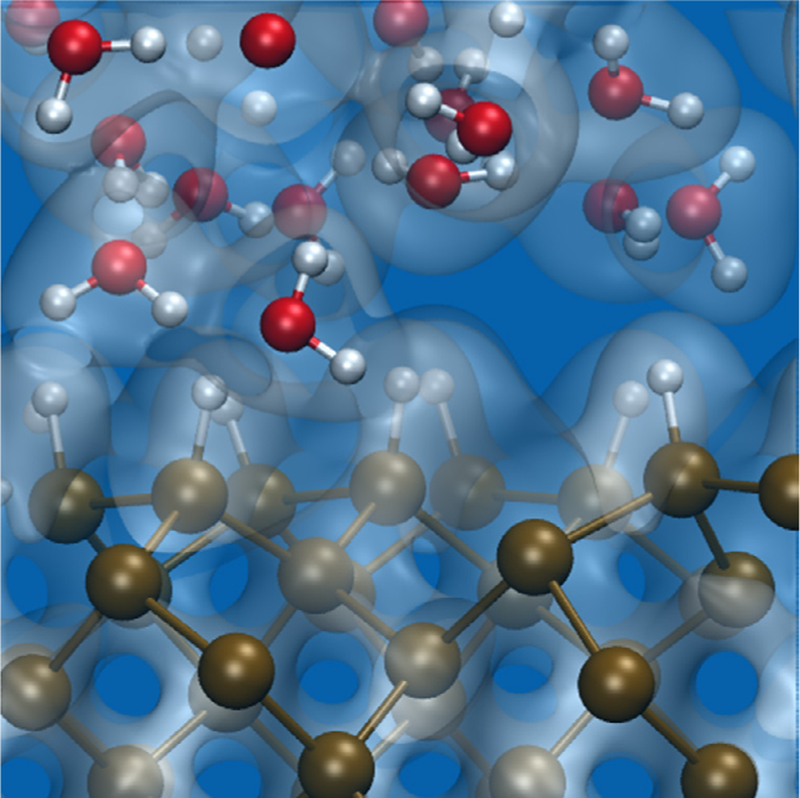
Atomistic configuration extracted from a first principles MD simulation of a Si-water interface. The Si surface is hydrogenated. Brown, white and red spheres represent Si, H and O atoms, respectively. The electronic charge density is represented by grey iso-surfaces.

Ball and stick representation (lower panel) of a SiC surface with alternating hydrophilic and hydrophobic geometrical arrangements. Chemical reactions occurring between water and the hydrophilic part of the surface, as studied from first principles, are schematically shown on the upper panel. Red, white, grey and blue spheres represent O, H, C and Si atoms, respectively.
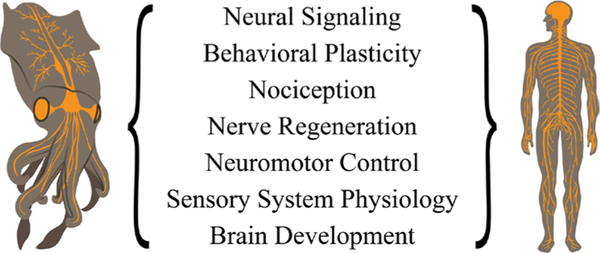
Classic neuroscience studies performed in cephalopods that have helped advance analogous scientific understanding in humans.

A protonic device, wherein the active layer is composed of a proton-conducting biopolymer, such as a melanin variant, a chitosan derivative, or a reflectin isoform (inset, bottom left), and the electrodes are composed of a proton-injecting alloy, such as palladium hydride (inset, bottom right). Note that representative generalized structures are shown for the constituent materials. The device is interfaced with a single living cell that features trans-membrane proton channels.

Spectral view on current and future challenges in sensing of bioelectric activity on the level of proteins, subcellular and cellular electric fluctuations. Currently explored versus unexplored frequency region of the cellular electromagnetic activity in logarithmic scale. In terms of bandwidth, the frequency region being explored by classical electrophysiology techniques represents only 10 kHz out of whole electromagnetic spectrum.
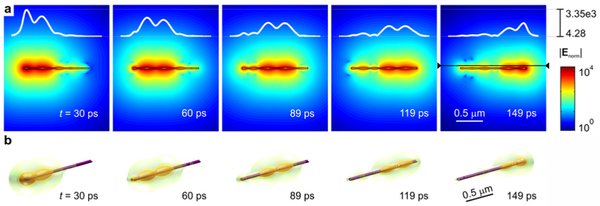
Ultrafast sub-nanosecond scale electric phenomena predicted in MTs (cytoskeleton protein fibers), image adapted from [139]. (a) Propagation of the electric pulse along the MT. Normalized intensity of the electric field is depicted in a logarithmic scale according to the presented color-bar. The shape of the pulse, as an electric field intensity along the line parallel to the MT axis in the distance of 43 nm from the wall of the MTs, is shown by the white line, on a linear scale. (b) An isosurface of the electric field intensity is used to visualize the shape of the pulse and its propagation in 3D.
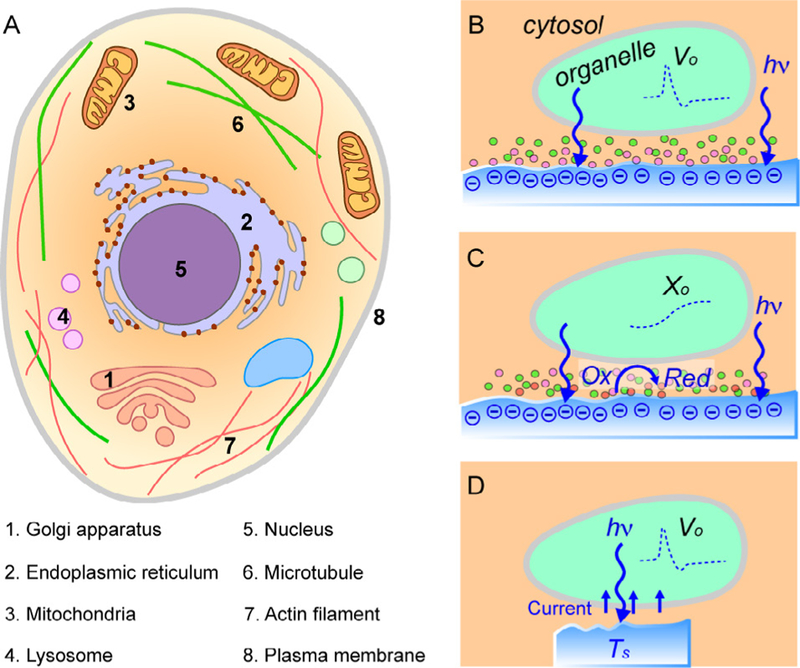
Intracellular biophysical interfaces. (A) Organelles are the new target for silicon-enabled cellular biophysics studies. (B) Modulation by the light-induced capacitive effect. (C) Modulation by photogalvanic process, where oxidation/reduction (Ox/Red) reactions happen near the silicon surface. (D) Fast photothermal effect from the silicon (Ts) can change the electrical capacitance of the lipid membrane. In these situations, light illumination could change Xo (intra-organelle ion concentration) or Vo (intra-organelle potential).
References
-
- Irimia-Vladu M et al. 2010. Biocompatible and biodegradable materials for organic field-effect transistors Adv. Funct. Mater 20 4069–76
Publication types
MeSH terms
Substances
Grants and funding
LinkOut - more resources
Full Text Sources
Other Literature Sources