

Stomach cancer survival in the United States by race and stage (2001-2009): Findings from the CONCORD-2 study
- PMID: 29205310
- PMCID: PMC5826592
- DOI: 10.1002/cncr.30881
Stomach cancer survival in the United States by race and stage (2001-2009): Findings from the CONCORD-2 study
Abstract
Background: Stomach cancer was a leading cause of cancer-related deaths early in the 20th century and has steadily declined over the last century in the United States. Although incidence and death rates are now low, stomach cancer remains an important cause of morbidity and mortality in black, Asian and Pacific Islander, and American Indian/Alaska Native populations.
Methods: Data from the CONCORD-2 study were used to analyze stomach cancer survival among males and females aged 15 to 99 years who were diagnosed in 37 states covering 80% of the US population. Survival analyses were corrected for background mortality using state-specific and race-specific (white and black) life tables and age-standardized using the International Cancer Survival Standard weights. Net survival is presented up to 5 years after diagnosis by race (all, black, and white) for 2001 through 2003 and 2004 through 2009 to account for changes in collecting Surveillance, Epidemiology, and End Results Summary Stage 2000 data from 2004.
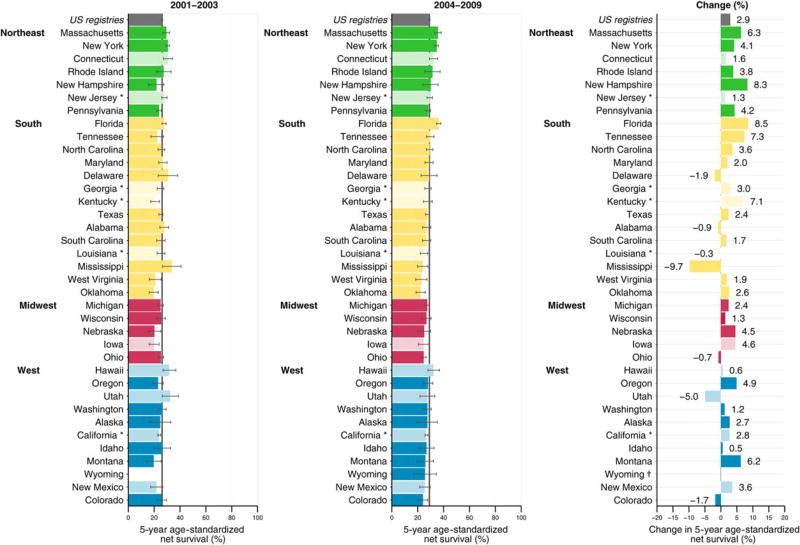
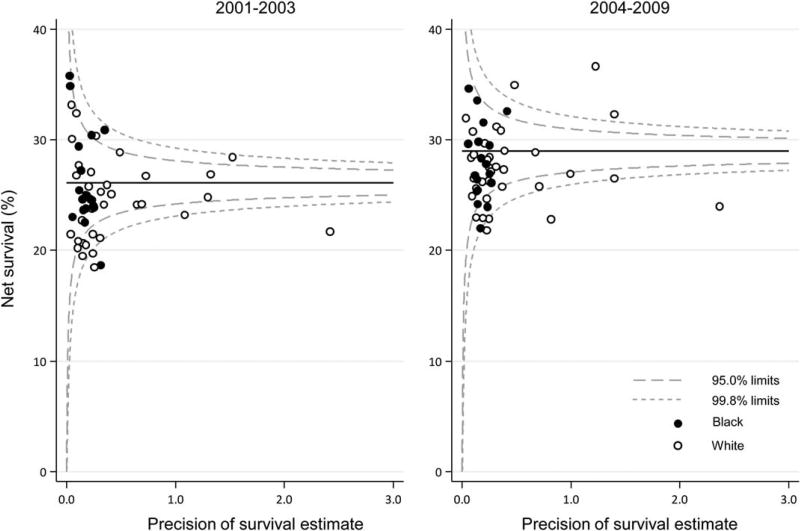
Results: Almost one-third of stomach cancers were diagnosed at a distant stage among both whites and blacks. Age-standardized 5-year net survival increased between 2001 to 2003 and 2004 to 2009 (26.1% and 29%, respectively), and no differences were observed by race. The 1-year, 3-year, and 5-year survival estimates were 53.1%, 33.8%, and 29%, respectively. Survival improved in most states. Survival by stage was 64% (local), 28.2% (regional), and 5.3% (distant).
Conclusions: The current results indicate high fatality for stomach cancer, especially soon after diagnosis. Although improvements in stomach cancer survival were observed, survival remained relatively low for both blacks and whites. Primary prevention through the control of well-established risk factors would be expected to have the greatest impact on further reducing deaths from stomach cancer. Cancer 2017;123:4994-5013. Published 2017. This article is a U.S. Government work and is in the public domain in the USA.
Keywords: CONCORD study; Epidemiology; National Program of Cancer Registries (NPCR); Surveillance; and End Results (SEER); cancer registries; gastric cancer; population-based cancer survival; stomach cancer.
Published 2017. This article is a U.S. Government work and is in the public domain in the USA.
Conflict of interest statement
CONFLICT OF INTEREST DISCLOSURES
The authors made no disclosures.
Figures
References
-
- Wingo PA, Cardinez CJ, Landis SH, et al. Long-term trends in cancer mortality in the United States, 1930–1998. Cancer. 2003;97:3133–3275. - PubMed
-
- Howson CP, Hiyama T, Wynder EL. The decline in gastric cancer: epidemiology of an unplanned triumph. Epidemiol Rev. 1986;8:1–27. - PubMed
-
- US Cancer Statistics Working Group. United States Cancer Statistics: 1999–2013 Incidence and Mortality [web-based report] Atlanta, GA: US Department of Health and Human Services, Centers for Disease Control and Prevention, National Cancer Institute; 2016. [Accessed August 1, 2017]. Available at: www.cdc.gov/uscs.
MeSH terms
Grants and funding
LinkOut - more resources
Full Text Sources
Other Literature Sources
Medical
