

Prostate cancer survival in the United States by race and stage (2001-2009): Findings from the CONCORD-2 study
- PMID: 29205313
- PMCID: PMC6077841
- DOI: 10.1002/cncr.31026
Prostate cancer survival in the United States by race and stage (2001-2009): Findings from the CONCORD-2 study
Abstract
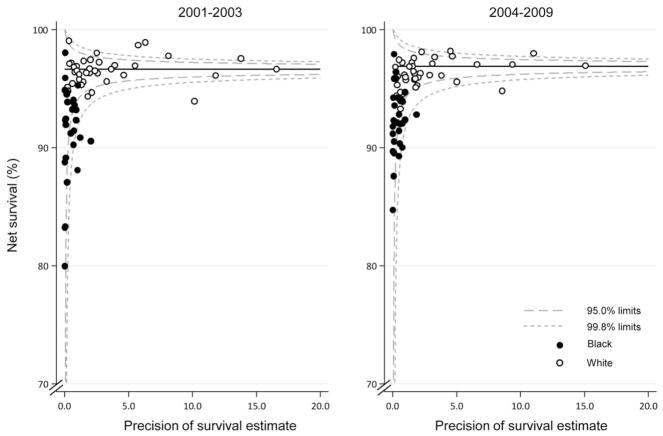
Background: The 5-year relative survival for prostate cancers diagnosed between 1990 and 1994 in the United States was very high (92%); however, survival in black males was 7% lower compared with white males. The authors updated these findings and examined survival by stage and race.
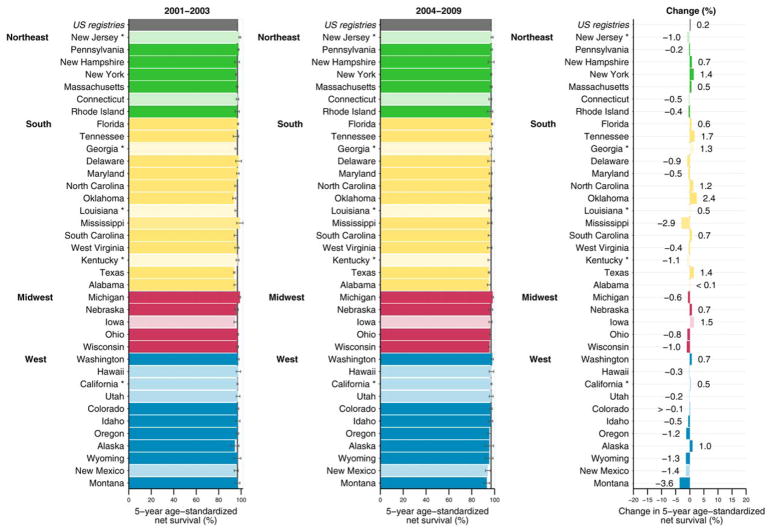
Methods: The authors used data from the CONCORD-2 study for males (ages 15-99 years) who were diagnosed with prostate cancer in 37 states, covering 80% of the US population. Survival was adjusted for background mortality (net survival) using state-specific and race-specific life tables and was age-standardized. Data were presented for 2001 through 2003 and 2004 through 2009 to account for changes in collecting SEER Summary Stage 2000.
Results: Among the 1,527,602 prostate cancers diagnosed between 2001 and 2009, the proportion of localized cases increased from 73% to 77% in black males and from 77% to 79% in white males. Although the proportion of distant-stage cases was higher among black males than among white males, they represented less than 6% of cases in both groups between 2004 and 2009. Net survival exceeded 99% for localized stage between 2004 and 2009 in both racial groups. Overall, and in most states, 5-year net survival exceeded 95%.
Conclusions: Prostate cancer survival has increased since the first CONCORD study, and the racial gap has narrowed. Earlier detection of localized cancers likely contributed to this finding. However, racial disparities also were observed in overall survival. To help understand which factors might contribute to the persistence of this disparity, states could use local data to explore sociodemographic characteristics, such as survivors' health insurance status, health literacy, treatment decision-making processes, and treatment preferences. Cancer 2017;123:5160-77. Published 2017. This article is a U.S. Government work and is in the public domain in the USA.
Keywords: Epidemiology; Surveillance; and End Results (SEER) summary stage; cancer registries; early detection of cancer; population-based survival; prevention and control; prostate cancer; therapeutics; trends.
Published 2017. This article is a U.S. Government work and is in the public domain in the USA.
Conflict of interest statement
CONFLICT OF INTEREST DISCLOSURES
The authors made no disclosures.
Figures
References
-
- Torre LA, Bray F, Siegel RL, Ferlay J, Lortet-Tieulent J, Jemal A. Global cancer statistics, 2012. CA Cancer J Clin. 2015;65:87–108. - PubMed
-
- US Cancer Statistics (USCS) Working Group. US Cancer Statistics: 1999–2013 Incidence and Mortality Web-Based Report. Atlanta, GA: US Department of Health and Human Services, Centers for Disease Control, Prevention and National Cancer Institute; 2016. [Accessed April 1, 2016]. Available at: www.cdc.gov/uscs.
-
- National Cancer Institute. Prostate specific antigen (PSA) test. Bethesda, MD: National Cancer Institute; 2016. [Accessed March 31, 2016]. Available at: http://www.cancer.gov/types/prostate/psa-fact-sheet.
-
- Hankey BF, Feuer EJ, Clegg LX, et al. Cancer surveillance series: interpreting trends in prostate cancer—Part I: evidence of the effects of screening in recent prostate cancer incidence, mortality, and survival rates. J Natl Cancer Inst. 1999;91:1017–1024. - PubMed
MeSH terms
Grants and funding
LinkOut - more resources
Full Text Sources
Other Literature Sources
Medical
Miscellaneous
