. 2018 Mar;232(3):485-496.
doi: 10.1111/joa.12760. Epub 2017 Dec 4.

Quantitative analysis of hepatic macro- and microvascular alterations during cirrhogenesis in the rat

Affiliations

Quantitative analysis of hepatic macro- and microvascular alterations during cirrhogenesis in the rat

Geert Peeters et al. J Anat. 2018 Mar.

Abstract

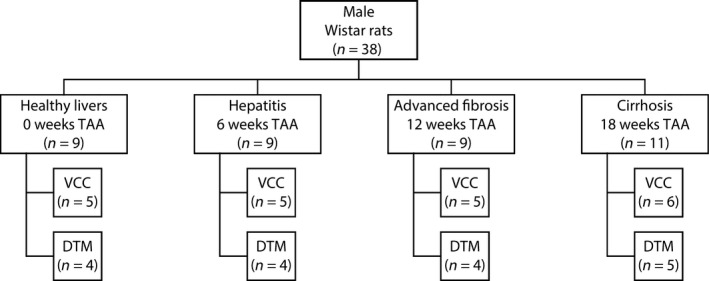
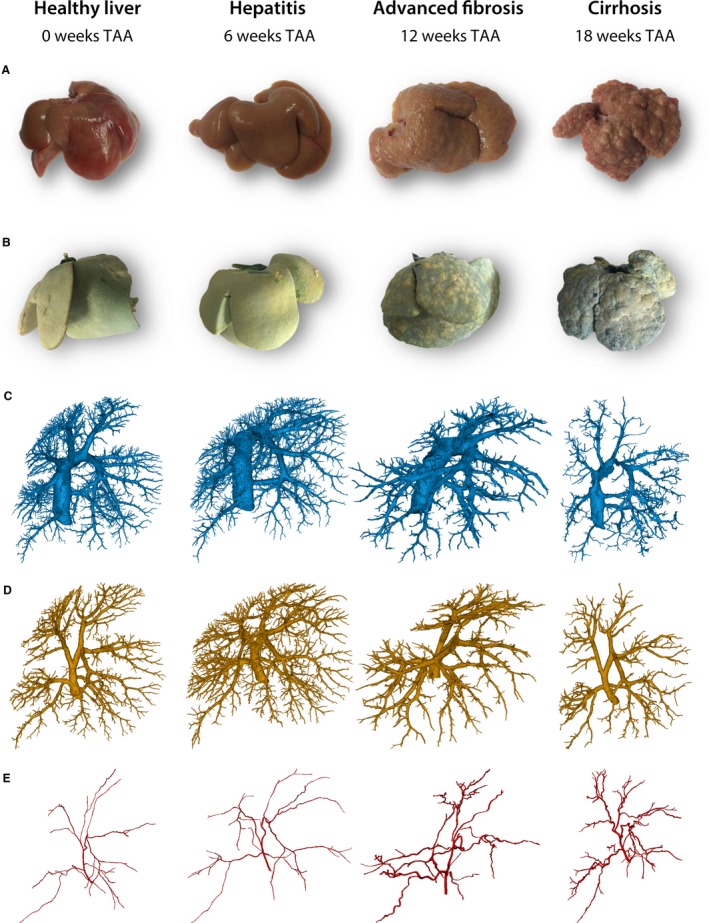
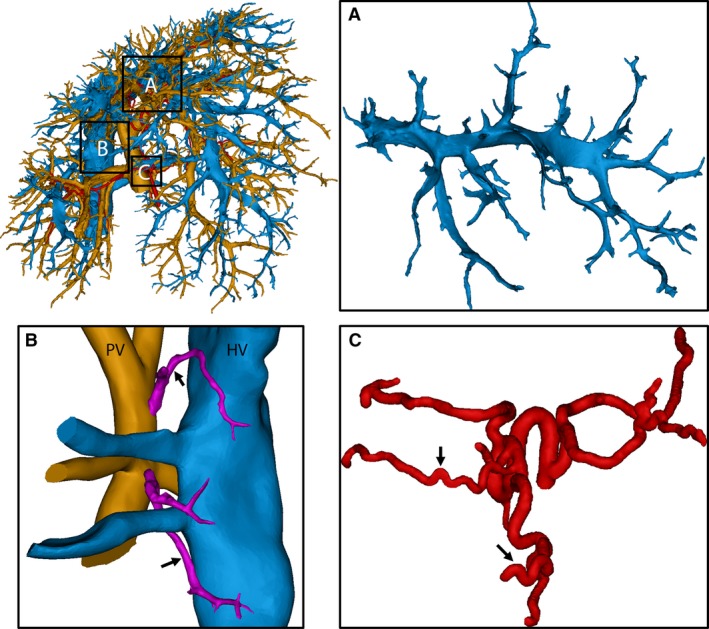
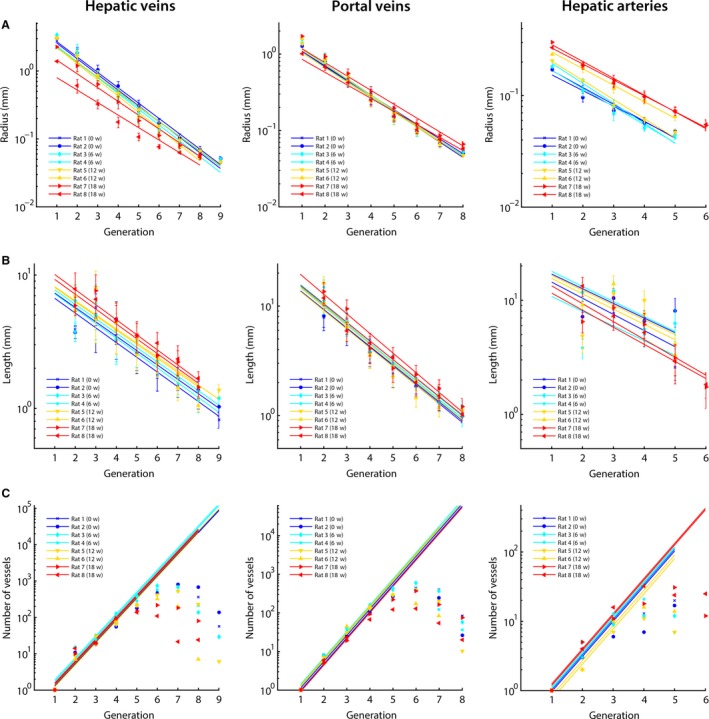
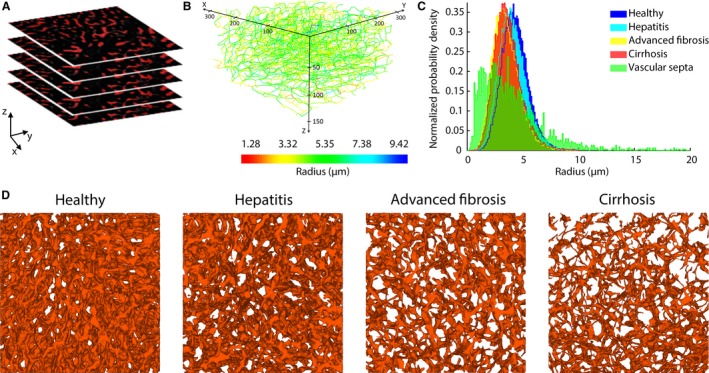
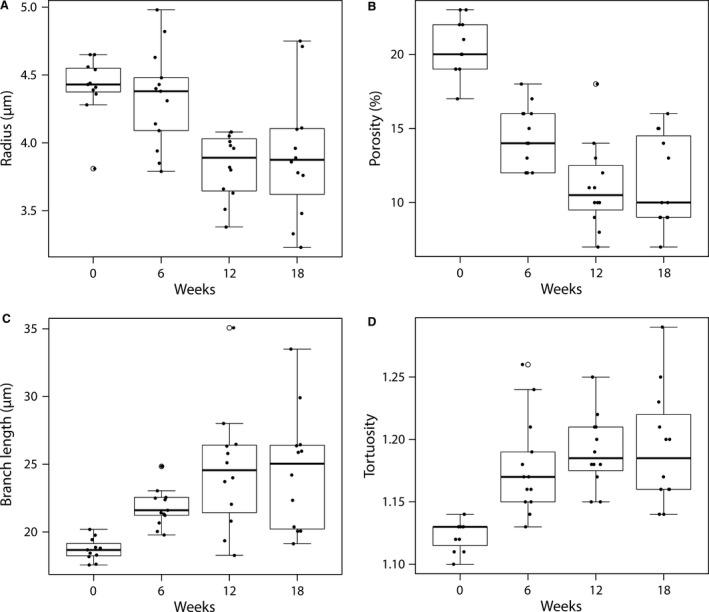
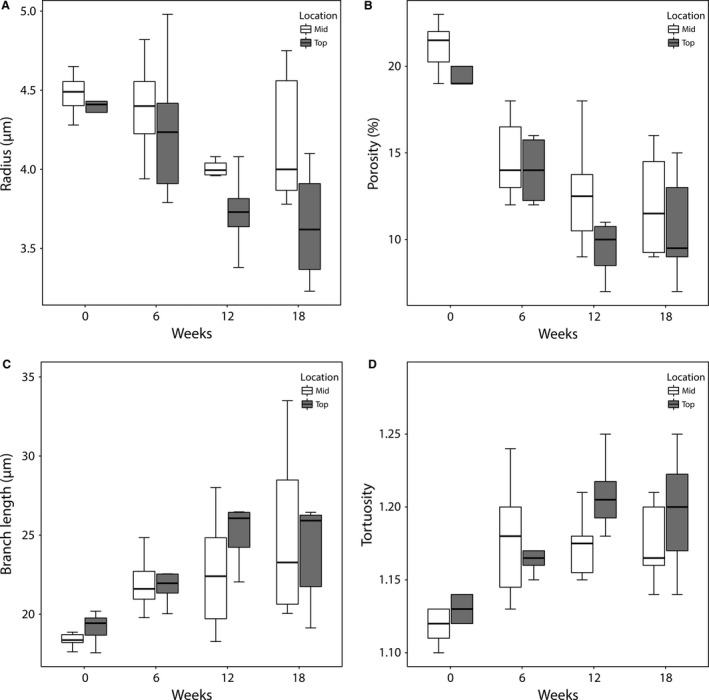
Cirrhosis represents the end-stage of any persistent chronically active liver disease. It is characterized by the complete replacement of normal liver tissue by fibrosis, regenerative nodules, and complete fibrotic vascularized septa. The resulting angioarchitectural distortion contributes to an increasing intrahepatic vascular resistance, impeding liver perfusion and leading to portal hypertension. To date, knowledge on the dynamically evolving pathological changes of the hepatic vasculature during cirrhogenesis remains limited. More specifically, detailed anatomical data on the vascular adaptations during disease development is lacking. To address this need, we studied the 3D architecture of the hepatic vasculature during induction of cirrhogenesis in a rat model. Cirrhosis was chemically induced with thioacetamide (TAA). At predefined time points, the hepatic vasculature was fixed and visualized using a combination of vascular corrosion casting and deep tissue microscopy. Three-dimensional reconstruction and data-fitting enabled cirrhogenic features to extracted at multiple scales, portraying the impact of cirrhosis on the hepatic vasculature. At the macrolevel, we noticed that regenerative nodules severely compressed pliant venous vessels from 12 weeks of TAA intoxication onwards. Especially hepatic veins were highly affected by this compression, with collapsed vessel segments severely reducing perfusion capabilities. At the microlevel, we discovered zone-specific sinusoidal degeneration, with sinusoids located near the surface being more affected than those in the middle of a liver lobe. Our data shed light on and quantify the evolving angioarchitecture during cirrhogenesis. These findings may prove helpful for future targeted invasive interventions.

Keywords: 3D reconstruction; cirrhosis; deep tissue microscopy; hepatic vasculature; micro-CT imaging; morphological analysis; rat liver; vascular corrosion casting.


Figures

Figure 1
Figure 1
Male Wistar rats were randomly divided into four groups. Each group consisted of nine animals, except for the cirrhosis group, where two extra animals were allocated to accommodate potential mortality. Five animals of each group (six in the case of cirrhosis) were assigned to the combination of vascular corrosion casting (VCC) and micro‐CT imaging to study the macrocirculation. Four animals (five in the case of cirrhosis) were allocated to deep tissue microscopy (DTM) after immunofluorescence staining to capture the microcirculation.
Figure 2
Figure 2
(A) Rat livers were excised at different time points during cirrhogenesis. The macroscopic expression of the liver transformed from normal over an irregular ‘salt & pepper’‐like appearance at 6 weeks to an emerging nodular liver at 12 weeks and eventually macronodular liver at 18 weeks. (B) Vascular replicas obtained using vascular corrosion casting. Blue pigmented resin was injected via the portal vein (PV) and yellow dye was added to the arterial resin. (C–E) Macroscopic 3D reconstructions of the hepatic veins, the PV, and the hepatic artery, respectively.
Figure 3
Figure 3
3D reconstruction of the macrocirculation of a cirrhotic rat liver (18 weeks). (A) The amendable hepatic veins (HV) in the middle medial lobe were significantly compressed by regenerative nodules and some branches even appeared to collapse. (B) Portosystemic shunts were detected (arrows), shunting directly from the root of the portal vein (PV) into the HV (caudal vena cava). Branching trees from the PV and HV were cut to provide a better view of the shunts. (C) Due to cirrhosis, arterial branches became more tortuous, resulting in sudden sharp bends (arrows).
Figure 4
Figure 4
The hepatic macrovascular trees – hepatic veins (HV), portal vein (PV), and hepatic artery (HA) – were classified according to their diameter‐defined branching topology. For each liver intoxicated with thioacetamide during different weeks (0, 6, 12, and 18 weeks), (A) the mean radius, (B) the mean length, and (C) the number of vessels were measured as a function of the generation number and exponential trend lines were fitted. For the number of vessels, trends lines were fitted based on the first four generations of the PV and HV (and three for the HA). In this way, an inaccuracy of the number of vessels due to under‐segmentation was limited. The trend lines clearly illustrate the impact of cirrhosis on the HV, with mean diameters nearly halving across the first generations due to the mechanical compression of regenerative nodules and fibrous tissue. The HA, on the other hand, dilated with increasing intoxication time. We did not observe any trends during cirrhogenesis for the number of vessels and length as function of the generation number.
Figure 5
Figure 5
(A) Example of a stack of 2D images acquired through deep tissue microscopy (DTM) after immunohistochemistry. (B) The dataset was automatically processed to segment the sinusoidal network and convert it to a graph. Here, the network graph is coloured according to the mean radius of the branches. The graph allowed other morphological parameters to be extracted, including the length, tortuosity, and porosity. (C) Histograms of the sinusoidal radii during the different cirrhogenic stages. The values visibly shift to the left, when progressing from a normal to cirrhotic liver. At 12 and 18 weeks, we differentiated between the sinusoids in regenerative nodules and the microvascular vessels in the vascular septa. These vascular septa comprised a substantial number of smaller vessels, but also a considerable number of large shunt vessels (diameter > 10 μm). (D) 3D reconstructions of the intricate sinusoidal network obtained with DTM (140‐μm‐thick samples) for the different time points. The porosity (= volume of blood vessels per volume unit) of the depicted samples steadily declined from 19% (normal) to 16% (hepatitis) to 9% (advanced fibrosis) to 7% (cirrhosis).
Figure 6
Figure 6
Boxplots for (A) the radius, (B) the porosity, (C) the branch length, and (D) the tortuosity of the microcirculation as function of TAA intoxication time. The radius and porosity differed significantly between healthy (week 0) and cirrhotic livers (week 18; P < 0.05). Both parameters decreased gradually during the cirrhogenic progression, and as such contributed to the increased intrahepatic vascular resistance. On the other hand, the sinusoidal tortuosity and length increased only slightly, though still significantly, when going from healthy to cirrhotic livers.
Figure 7
Figure 7
Boxplots for (A) the radius, (B) the porosity, (C) the branch length, and (D) the tortuosity of the microcirculation as function of TAA intoxication time and location within the lobe. Slices (350 μm) were taken near the top (up to 2 mm from the surface) and mid (4–6 mm from the surface) region of the right medial lobe (RML). Sinusoids situated in the core of the lobe appeared to be less affected by the cirrhogenic process, as their mean radii and porosity were typically larger than those near the surface. When comparing the 18‐week intoxicated samples pairwise, the radii differed significantly between the top and mid region (P = 0.048).

References

    1. Aagaard J, Jensen LI, Sorensen T, et al. (1982) Recanalized umbilical vein in portal hypertension. Am J Roentgenol 139, 1107–1110. - PubMed
    1. Alexander B, Cottam H, Naftalin R (2001) Hepatic arterial perfusion regulates portal venous flow between hepatic sinusoids and intrahepatic shunts in the normal rat liver in vitro . Pflugers Arch 443, 257–264. - PubMed
    1. Anthony PP, Ishak KG, Nayak NC, et al. (1978) The morphology of cirrhosis. Recommendations on definition, nomenclature, and classification by a working group sponsored by the World Health Organization. J Clin Pathol 31, 395–414. - PMC - PubMed
    1. Bhargava P, Vaidya S, Kolokythas O, et al. (2011) Pictorial review. Hepatic vascular shunts: embryology and imaging appearances. Br J Radiol 84, 1142–1152. - PMC - PubMed
    1. Bodner G, Peer S, Karner M, et al. (2002) Nontumorous vascular malformations in the liver: color Doppler ultrasonographic findings. J Ultrasound Med 21, 187–197. - PubMed

Publication types

LinkOut - more resources