

Fission yeast Myo2: Molecular organization and diffusion in the cytoplasm
- PMID: 29205883
- PMCID: PMC5899921
- DOI: 10.1002/cm.21425
Fission yeast Myo2: Molecular organization and diffusion in the cytoplasm
Abstract
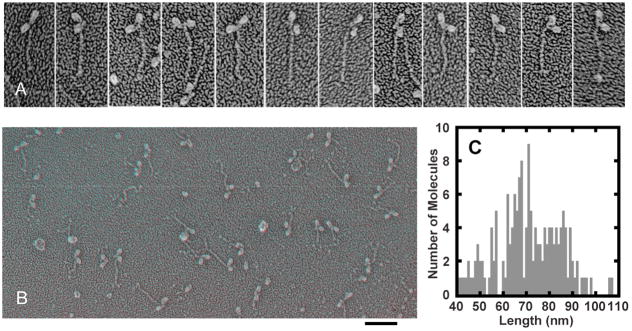
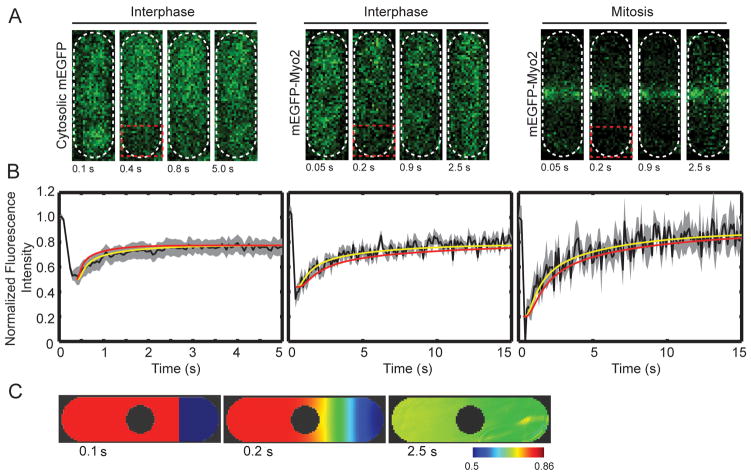
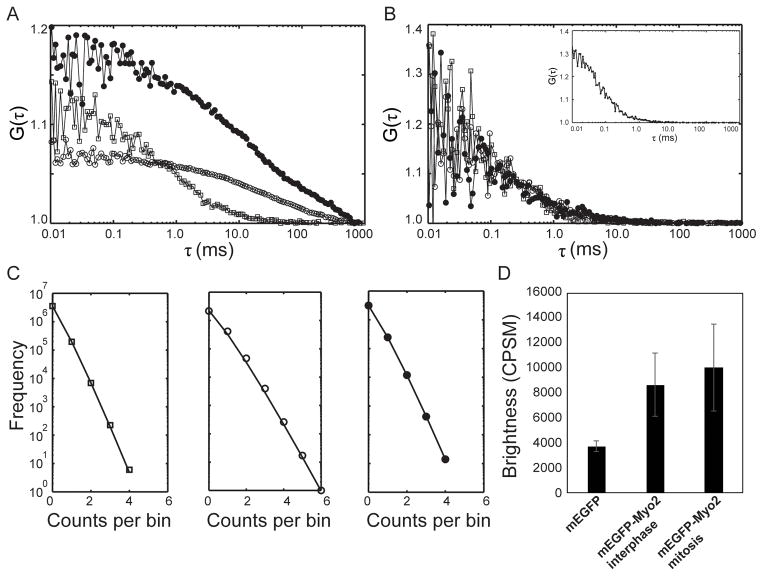
Myosin-II is required for the assembly and constriction of cytokinetic contractile rings in fungi and animals. We used electron microscopy, fluorescence recovery after photobleaching (FRAP), and fluorescence correlation spectroscopy (FCS) to characterize the physical properties of Myo2 from fission yeast Schizosaccharomyces pombe. By electron microscopy, Myo2 has two heads and a coiled-coiled tail like myosin-II from other species. The first 65 nm of the tail is a stiff rod, followed by a flexible, less-ordered region up to 30 nm long. Myo2 sediments as a 7 S molecule in high salt, but aggregates rather than forming minifilaments at lower salt concentrations; this is unaffected by heavy chain phosphorylation. We used FRAP and FCS to observe the dynamics of Myo2 in live S. pombe cells and in cell extracts at different salt concentrations; both show that Myo2 with an N-terminal mEGFP tag has a diffusion coefficient of ∼ 3 µm2 s-1 in the cytoplasm of live cells during interphase and mitosis. Photon counting histogram analysis of the FCS data confirmed that Myo2 diffuses as doubled-headed molecules in the cytoplasm. FCS measurements on diluted cell extracts showed that mEGFP-Myo2 has a diffusion coefficient of ∼ 30 µm2 s-1 in 50 to 400 mM KCl concentrations.
Keywords: contractile ring; electron microscopy; myosin-II.
© 2017 Wiley Periodicals, Inc.
Figures
Similar articles
-
Fission yeast myosin Myo2 is down-regulated in actin affinity by light chain phosphorylation.Proc Natl Acad Sci U S A. 2017 Aug 29;114(35):E7236-E7244. doi: 10.1073/pnas.1703161114. Epub 2017 Aug 14. Proc Natl Acad Sci U S A. 2017. PMID: 28808035 Free PMC article.
-
Localization of fission yeast type II myosin, Myo2, to the cytokinetic actin ring is regulated by phosphorylation of a C-terminal coiled-coil domain and requires a functional septation initiation network.Mol Biol Cell. 2001 Dec;12(12):4044-53. doi: 10.1091/mbc.12.12.4044. Mol Biol Cell. 2001. PMID: 11739799 Free PMC article.
-
Myosin-II reorganization during mitosis is controlled temporally by its dephosphorylation and spatially by Mid1 in fission yeast.J Cell Biol. 2004 Jun 7;165(5):685-95. doi: 10.1083/jcb.200402097. J Cell Biol. 2004. PMID: 15184401 Free PMC article.
-
Cytokinesis in fission yeast: a myosin pas de deux.Microsc Res Tech. 2000 Apr 15;49(2):152-60. doi: 10.1002/(SICI)1097-0029(20000415)49:2<152::AID-JEMT7>3.0.CO;2-7. Microsc Res Tech. 2000. PMID: 10816254 Review.
-
Myosin-cell wall interactions during cytokinesis in fission yeast: a framework for understanding plant cytokinesis?Cell Biol Int. 2003;27(3):239-40. doi: 10.1016/s1065-6995(02)00311-6. Cell Biol Int. 2003. PMID: 12681321 Review. No abstract available.
Cited by
-
Fluorescence techniques in developmental biology.J Biosci. 2018 Jul;43(3):541-553. J Biosci. 2018. PMID: 30002271 Review.
-
Imaging Cytoskeleton Components by Electron Microscopy.Methods Mol Biol. 2022;2364:25-52. doi: 10.1007/978-1-0716-1661-1_2. Methods Mol Biol. 2022. PMID: 34542847 Free PMC article.
-
Actin turnover protects the cytokinetic contractile ring from structural instability.J Cell Sci. 2023 Mar 1;136(5):jcs259969. doi: 10.1242/jcs.259969. Epub 2022 Oct 6. J Cell Sci. 2023. PMID: 36052670 Free PMC article.
-
Molecular form and function of the cytokinetic ring.J Cell Sci. 2019 Jun 17;132(12):jcs226928. doi: 10.1242/jcs.226928. J Cell Sci. 2019. PMID: 31209062 Free PMC article. Review.
-
Comparative Analysis of the Roles of Non-muscle Myosin-IIs in Cytokinesis in Budding Yeast, Fission Yeast, and Mammalian Cells.Front Cell Dev Biol. 2020 Nov 19;8:593400. doi: 10.3389/fcell.2020.593400. eCollection 2020. Front Cell Dev Biol. 2020. PMID: 33330476 Free PMC article. Review.
References
-
- Bezanilla M, Wilson JM, Pollard TD. Fission yeast myosin-II isoforms assemble into contractile rings at distinct times during mitosis. Curr Biol. 2000;10(7):397–400. - PubMed
Publication types
MeSH terms
Substances
Grants and funding
LinkOut - more resources
Full Text Sources
Other Literature Sources
Miscellaneous
