. 2017 Dec 5:6:e28626.
doi: 10.7554/eLife.28626.

Conformational dynamics in TRPV1 channels reported by an encoded coumarin amino acid

Affiliations

Conformational dynamics in TRPV1 channels reported by an encoded coumarin amino acid

Ximena Steinberg et al. Elife. .

Abstract

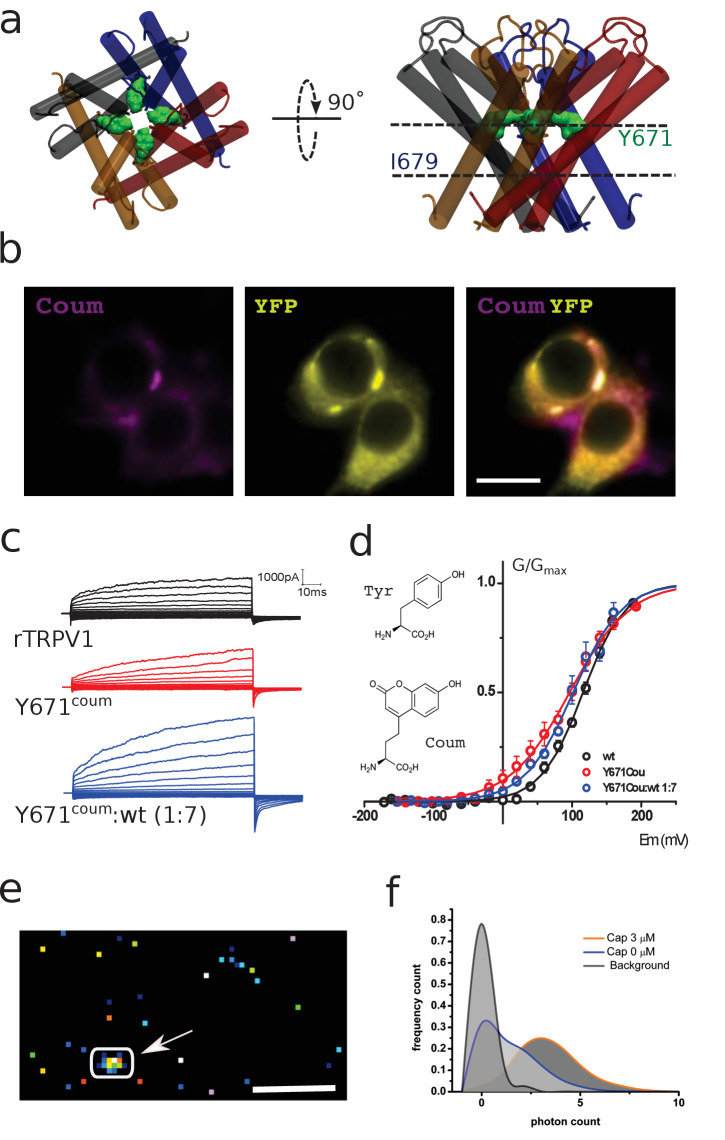
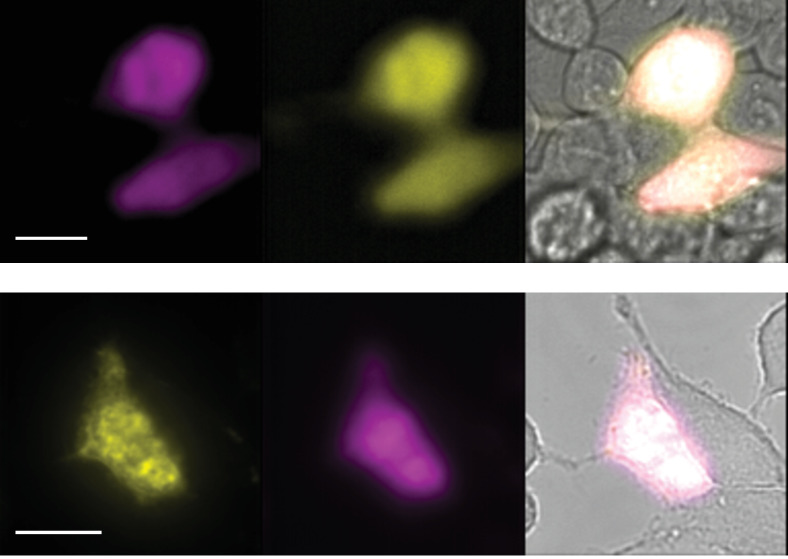
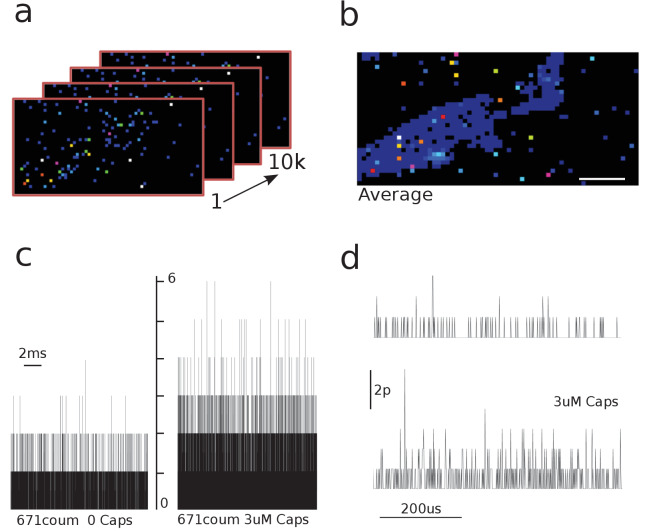
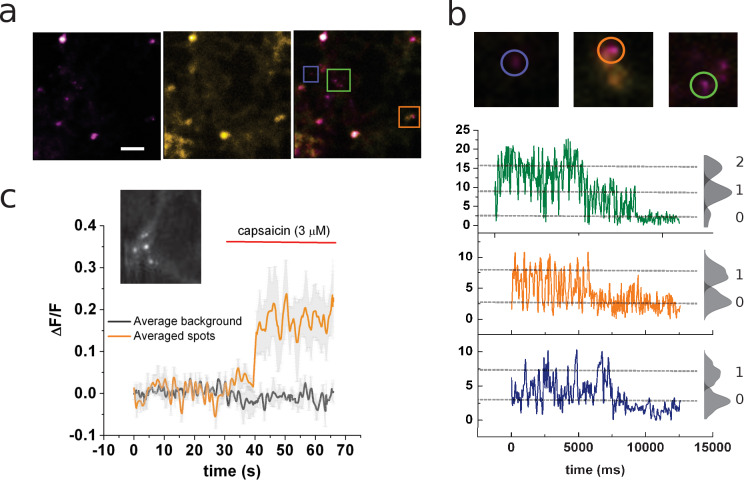
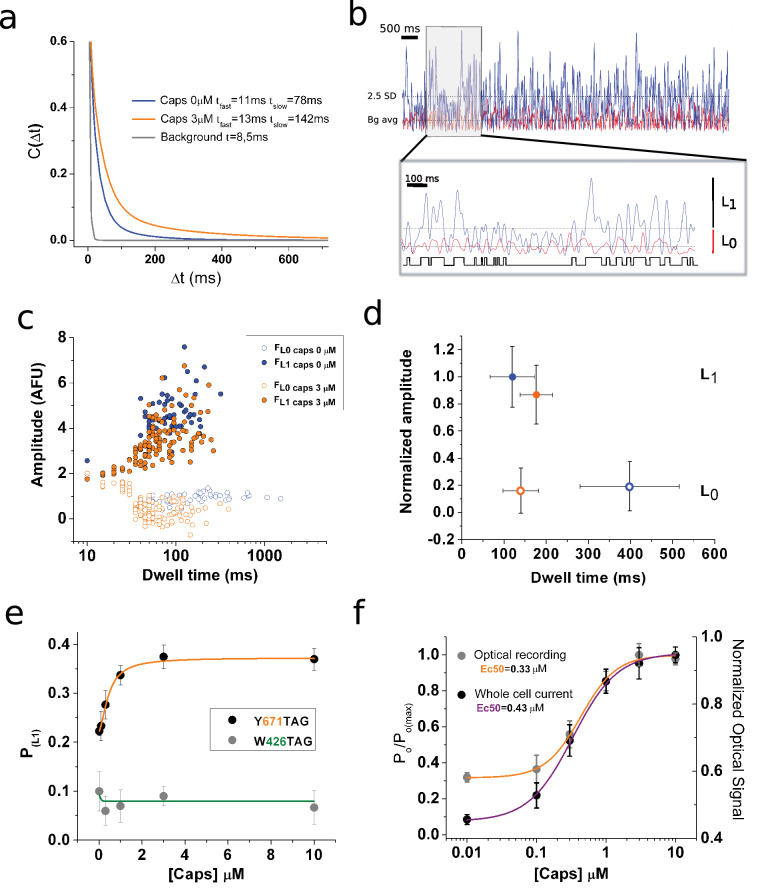
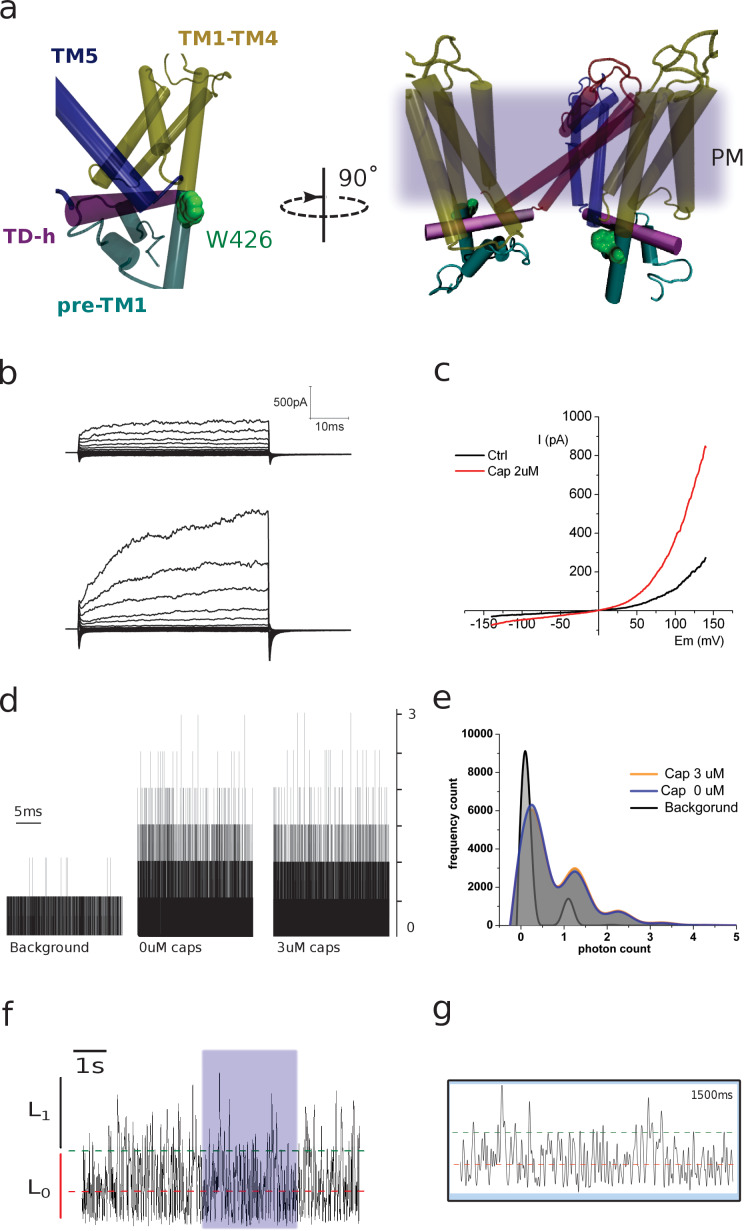
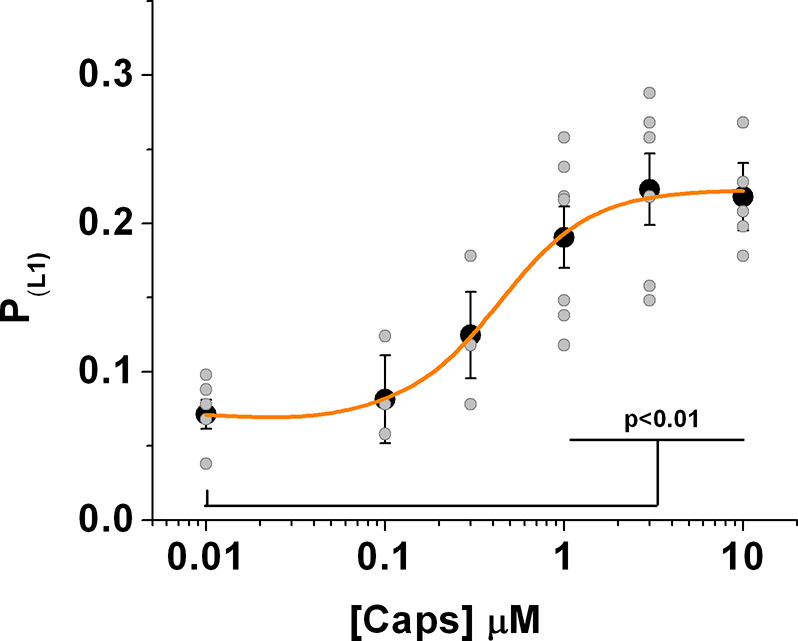
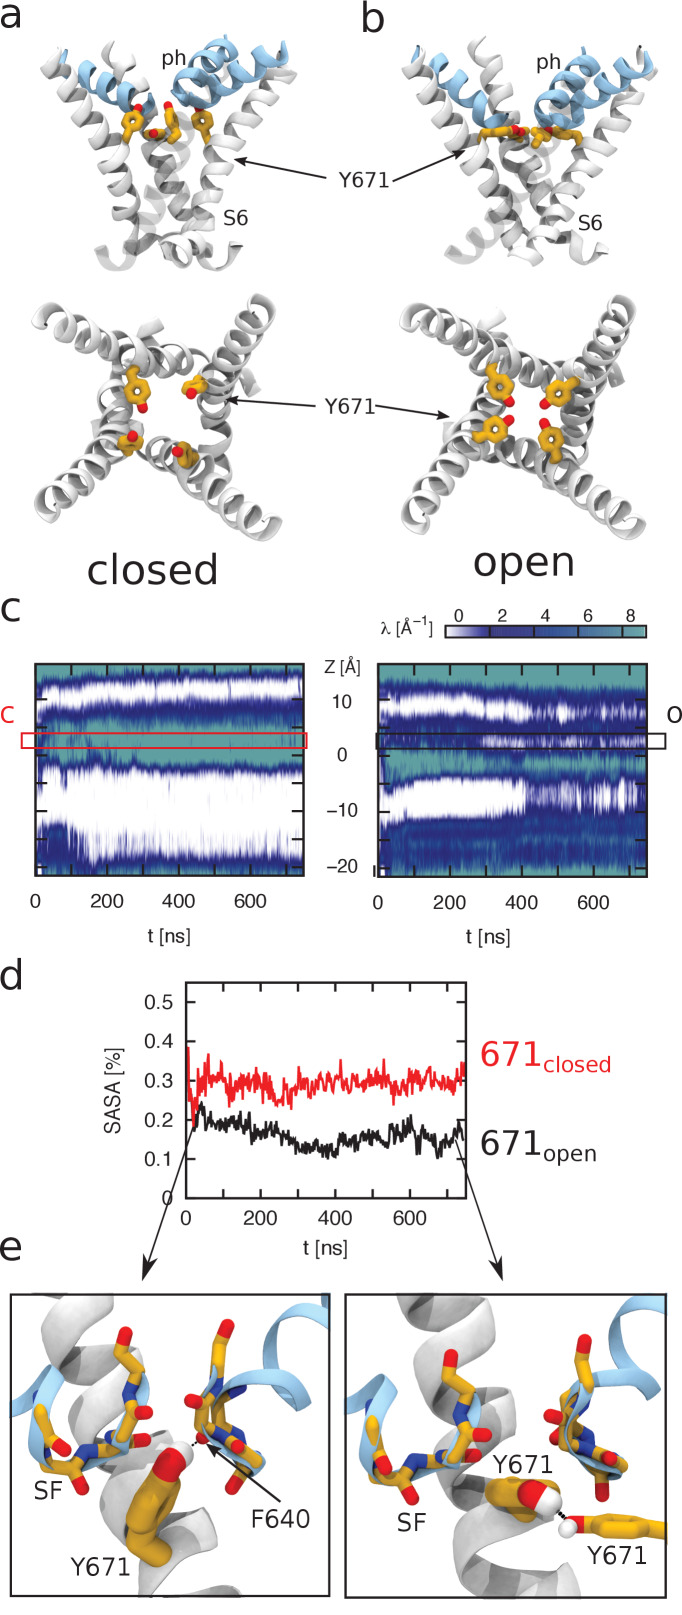
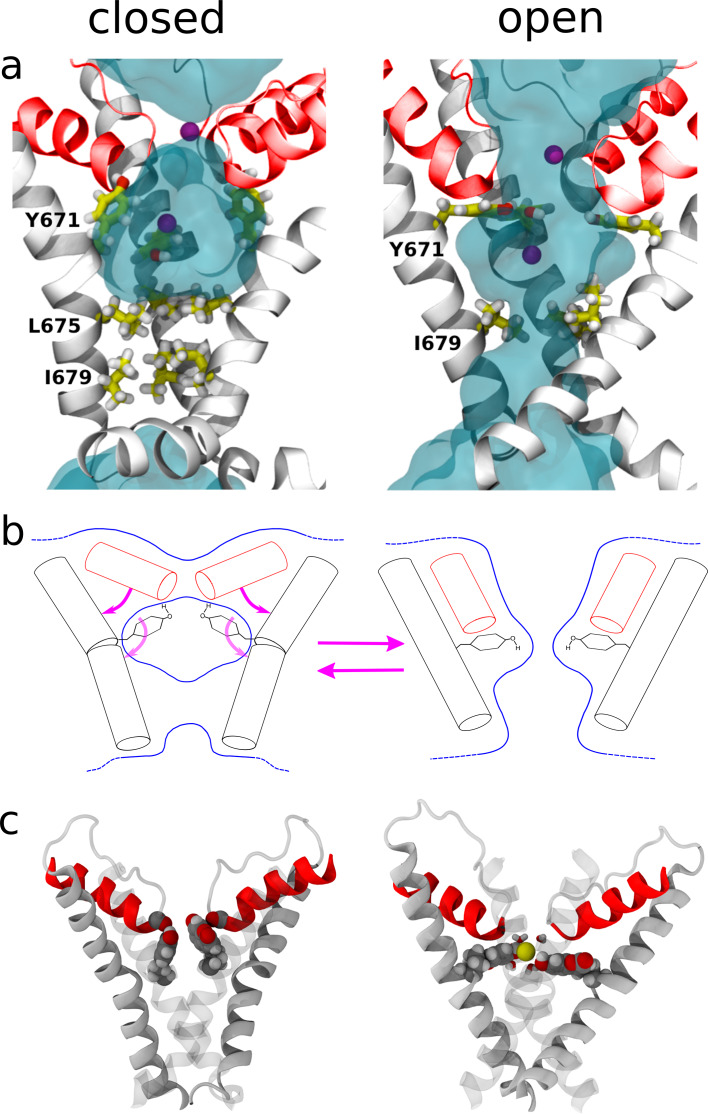
TRPV1 channels support the detection of noxious and nociceptive input. Currently available functional and structural data suggest that TRPV1 channels have two gates within their permeation pathway: one formed by a 'bundle-crossing' at the intracellular entrance and a second constriction at the selectivity filter. To describe conformational changes associated with channel gating, the fluorescent non-canonical amino acid coumarin-tyrosine was genetically encoded at Y671, a residue proximal to the selectivity filter. Total internal reflection fluorescence microscopy was performed to image the conformational dynamics of the channels in live cells. Photon counts and optical fluctuations from coumarin encoded within TRPV1 tetramers correlates with channel activation by capsaicin, providing an optical marker of conformational dynamics at the selectivity filter. In agreement with the fluorescence data, molecular dynamics simulations display alternating solvent exposure of Y671 in the closed and open states. Overall, the data point to a dynamic selectivity filter that may serve as a gate for permeation.

Keywords: SPAD; TRPV1; biophysics; computational biology; coumarin; gating; non-canonical amino acids; none; pore; structural biology; systems biology.

Plain language summary

Cells use proteins on their surface as sensors to help them to assess and explore their environments and adapt to external conditions. The transient receptor potential (TRP) ion channels form one such family of proteins. Sodium, potassium and calcium ions can move through TRP channels to enter and exit cells, and by doing so trigger changes in the cell that help it respond to an external stimulus. The channels have physical “gates” that can open and close to control the flow of the ions. When the TRP channel detects a stimulus – which could take the form of specific chemicals, or a change in temperature, pressure or voltage – it changes shape, causing the gate to open. Researchers have a number of unanswered questions about how TRP channels work. Where in the channels are gates located? How do the channels control the flow of ions, and how do they communicate with each other? And which regions of the protein sense environmental cues? As a result, new technologies are being developed to make it easier to study the types of rearrangements that TRP channels experience when they activate. Steinberg, Kasimova et al. have used total internal reflection microscopy – a method that images fluorescent molecules – to measure the conformational change of a single TRP channel in a living cell. This channel, called TRPV1, senses external heat and plays an important role in pain perception. Its gate can also be opened by the pungent compound of chili pepper, capsaicin. The results of the experiments suggest that a selectivity filter region in TRPV1 channels changes its shape when the channel opens in response to capsaicin. Then, this selectivity filter appears to do double duty – it controls which types of ions pass through the channels as well as controlling their flow rate. Because of its role in pain perception, having a better understanding of how TRPV1 works will be valuable for researchers who are trying to develop new pain relief treatments. The so-called ‘seeing is believing’ method used by Steinberg, Kasimova et al. could also be used to study other membrane proteins, both to guide drug development and to improve our understanding of how cells interact with their environment.


Conflict of interest statement

No competing interests declared.

Figures

Figure 1.
Figure 1.. Functional expression of coumarin-containing TRPV1 channels at the membrane of HEK-293T cells.
(a) Top-down and lateral view of the pore region of rTRPV1 tetramers. Dashed lines denote the positions of putative gates, a canonical gate at I679 and a secondary constriction within the pore at Y671 (green shade). The different subunits are shown in different colors. (b) Epifluorescence images obtained from transiently transfected HEK-293T cells. Cells were co-transfected with wild-type rTRPV1-YPF and with rTRPV1-Y671coum. The scale bar corresponds to 10 µm. Images correspond to the average of 50 frames. (c) Representative traces obtained from transiently transfected HEK-293T cells subjected to voltage steps from −180 mV to +180 mV, in 20 mV increments, for the three different conditions indicated. No TRPV1 currents were seen from expressed Y671TAG channels co-expressed with the coumarin Rs and tRNA but lacking the supplemented amino acid in the culture media. (d) Conductance-voltage relation for the wild-type rTRPV1 (black) and the two different coumarin-containing channels (TRPV1-coumarin alone in red; 1xTRPV1coumarin +7xTRPV1wt in blue). Curves were fitted to a Boltzmann distribution of the form I = Imax/(1 + exp([zF(V-V0.5)/RT]), where z is the voltage dependency, V0.5 is the half-activation voltage, and Imax is the maximum current. Each curve represents the average of at least six different experiments performed at 20°C. Error bars correspond to standard errors of the mean (SEM). The structure of coumarin and tyrosine are depicted in wireframe. (e) Ten thousand frames were averaged and a threshold was set on the averaged image in order to define regions of interest (arrow indicates ROI). The scale bar corresponds to 5 µm. (f) The photon count was extracted from the original set of frames. Capsaicin incubation promotes a higher photon count distribution.
Figure 1—figure supplement 1.
Figure 1—figure supplement 1.. Two composites of epifluorescence images obtained from transiently transfected HEK-293T cells.
Cells were co-transfected with wild-type rTRPV1-YPF and rTRPV1-Y671coum. Scale bars correspond to 10 µm. Images correspond to the average of 40 frames (upper set) and 50 frames (lower set).
Figure 1—figure supplement 2.
Figure 1—figure supplement 2.. Capsaicin induces an increase in the photon count.
(a) 10, individual frames were taken with the 64 × 32 single-photon avalanche diode (SPAD) camera. (b) Images were averaged to identify cell area and regions of interest (ROIs). Scale bar represents 5 μm. (c) Raw traces of photon count recordings in the absence and presence of capsaicin. (d) Zoomed raw traces comparing background and coumarin-stimulated signals.
Figure 2.
Figure 2.. Identification of channels expressing a single coumarin emitter.
(a) Representative TIRF images of the 7:1 transfected cells. Images correspond to the average of 100 frames. Colocalization of coumarin diffraction-limited puncta with YFP signal is marked by colored squares. Scale bar corresponds to 2 µm. (b) Representative traces of photobleaching coumarin-positive spots. Top images correspond to the ROIs depicted in (a). Color-coded traces depict the time course of the fluorescence signal used later for the identification of individual spots that bleach on a single step. (c) Ensemble average of the signal recorded from multiple spots from the cell’s membrane shown in the inset. The image corresponds to the average of 80 frames taken on the coumarin channel (ex405nm/em450nm).
Figure 3.
Figure 3.. Optical studies of ion channel gating.
(a) Stationary noise of single spots, with each curve corresponding to the averaged fitted curves for the indicated conditions (n = 7, paired). The autocorrelation function was obtained for background (gray), capsaicin free (blue), and 3 μM capsaicin (orange). (b) Analysis of fluorescence fluctuations. Superimposed traces of capsaicin (blue) and background (red). The threshold for level one is highlighted (2.5 standard deviations [SD], dotted line). The gray box indicates the zoomed-in portion of the recording presented in the inset below, with the dotted lines indicating background average.. An idealization is shown in black. (c) Semi-log plot of the amplitude versus dwell-time shows a shortening of mean time L0. (d) Plot summarizing datasets of amplitude versus dwell time at 0 and 3 μM capsaicin (n = 5, paired). Error bars correspond to SEM. (e) Dose–response curve showing changes in the probability of level 1 (PL1), calculated from non-corrected fluorescence fluctuations, for the two positions tested for the indicated channel types expressing coumarin. (f) Normalized dose–response curves for background subtracted fluorescence fluctuations (orange) and whole-cell electrophysiological response (purple). The electrophysiological response was tested at −70 mV in the presence of the indicated concentrations of capsaicin. Error bars correspond to SEM.
Figure 3—figure supplement 1.
(a) Two lateral views showing the relative position of W426, located on the pre-TM1 region, outside the membrane. The different regions of the monomer are color coded as indicated. The image on the right depicts two subunits and the relative position of the channel with respect to the plasma membrane (diffuse gray). (b) Representative traces obtained from transiently transfected HEK-293T cells subjected to voltage steps from −180 mV to +180 mV in 20 mV increments. Traces correspond to non-stimulated and capsaicin-incubated conditions. (c) Current–voltage relationship for the conditions in b. (d) Raw traces of photon-count recordings in the absence and presence of capsaicin. (e) Capsaicin incubation does not affect photon-count distribution on 426coummutants. (f) Fluorescence fluctuations at 426coum. A signal trace is depicted and the background average indicated (red dashed line). The threshold for a single transition is highlighted (2.5 SD, green dashed line). (g) The purple-shaded box on panel f marks the zoomed-in portion of the recording shown here. Lines indicate background average and threshold. Time corresponds to the full zoomed signal inside the box.
Figure 3—figure supplement 2.
Figure 3—figure supplement 2.. Distribution of the whole data set obtained from the fluctuation analysis of the fluorescence signal.
Figure 4.
Figure 4.. Molecular dynamics simulations to calculate hydration of Y671.
Molecular dynamics (MD) simulations of TRPV1 channels in the open (a) and closed (b) states. The upper and lower panels correspond to the side and top views of the S6 helices bundle (white), respectively. The pore helices (ph) are shown in blue. Y671 residues are represented as yellow sticks. In the open state, four Y671 residues create a ring oriented parallel to the membrane plane (perpendicular to the pore principal axis); whereas in the closed state, three of these residues do not interact with each other and are oriented perpendicular to the membrane plane (parallel to the pore principal axis). (c) Hydration of the channel central pore. Panel c shows the time evolution of the density profile (of water oxygens) along the pore. Specifically, at each time frame, the water oxygen atoms number density (i.e. the number of particles per unit of length) is calculated as a function of z (the axis of the pore). This quantity is shown using a color scale. Note that the units are Å−1 (the number density for a linear system has the dimensions of the inverse of a length). The left and right panels correspond to the closed and open states, respectively. The y-axis of the plot denotes the z-axis of the system (parallel to the channel central pore). The origin of the axis is set at the center of the pore domain transmembrane part. The Y671 residues are located at ~2.5 Å. Note that in the open state, the water density is often interrupted starting from ~280 ns, whereas in the closed state, this density is continuous. (d) Solvent-accessible surface area (SASA) of Y671. Black and red curves correspond, respectively, to SASA over time for the open (black) and closed (red) states as indicated. In the closed state, the Y671 SASA is approximately twice as large as that in the open state starting from ~300 ns. (e) The panels show zoomed view of the Y671 in the closed (left) and open (right) states. In the open state, Y671 establishes a hydrogen bond with the Y671 of the adjacent subunit; whereas in the closed state, this residue interacts with the backbone of F640 located at the pore helix. The backbone of the selectivity filter (SF) is shown using a stick representation.
Figure 5.
Figure 5.. Structural changes resulting from rearrangements in the selectivity filter region.
(a) Representation of the channel structures in the closed (left) and open (right) states. For clarity, only S6 (white) and pore helix (red) are shown for three subunits. The side chains of Y671 (at the upper gate) and I679, I675 (bottom gate) are highlighted using a stick representation and the permeant Na+ ions are shown as purple spheres. Blue shades show the average density of water molecules calculated along the MD trajectory. Note how the water density forms a continuum throughout the pore only when in the open state. (b) Proposed mechanism for the opening and closing of the upper gate: the rearrangement of the four planar groups of residue 671 from the ‘vertical’ to the ‘horizontal ring’ configuration is accompanied by a change in the tilt (with respect to the membrane plane) of the N-terminus section of S6 and of the pore-helix. In particular, the motion of the pore-helix regulates the effective pore radius at the level of the selectivity filter. The outward motion of both the pore helix and the aromatic at position 671 cause a reduction in water and ion accessibility. (c) Molecular structure sampled along the MD trajectory of the coumarin mutant in the closed and open states. For clarity, only S6 and the pore helix are shown with two of the four subunits rendered as gray shading. The coumarin moieties are highlighted using a space-filling representation. Left: closed state. The hydroxyl group of coumarin is able to establish the same H-bonding interactions with the carbonyl group of the pore-helix observed in the wild type. Right: open state. A permeant Na+ ion (yellow sphere) is shown together with its first solvation shell (sticks). Note how the hydroxyl groups from coumarin contribute to the shell of neighbors of the ion.
Figure 5—figure supplement 1.
Figure 5—figure supplement 1.. Additional views of the coumarin mutant structures.
(a) Side view of the closed state. Note how the hydroxyl group of coumarin H-bonds a carbonyl oxygen from the adjacent subunit. (b) Top view of the open state highlighting the ‘horizontal’ configuration of the coumarin moieties.

Similar articles

Cited by

References

    1. Anderson CR, Stevens CF. Voltage clamp analysis of acetylcholine produced end-plate current fluctuations at frog neuromuscular junction. The Journal of Physiology. 1973;235:655–691. doi: 10.1113/jphysiol.1973.sp010410. - DOI - PMC - PubMed
    1. Blunck R, McGuire H, Hyde HC, Bezanilla F. Fluorescence detection of the movement of single KcsA subunits reveals cooperativity. PNAS. 2008;105:20263–20268. doi: 10.1073/pnas.0807056106. - DOI - PMC - PubMed
    1. Bronzi D, Villa F, Tisa S, Tosi A, Zappa F, Durini D, Weyers S, Brockherde W. 100 000 Frames/s 64 × 32 Single-Photon Detector Array for 2-D Imaging and 3-D Ranging. IEEE Journal of Selected Topics in Quantum Electronics. 2014;20:354–363. doi: 10.1109/JSTQE.2014.2341562. - DOI
    1. Cao E, Liao M, Cheng Y, Julius D. TRPV1 structures in distinct conformations reveal activation mechanisms. Nature. 2013;504:113–118. doi: 10.1038/nature12823. - DOI - PMC - PubMed
    1. Cha A, Bezanilla F. Characterizing voltage-dependent conformational changes in the Shaker K+ channel with fluorescence. Neuron. 1997;19:1127–1140. doi: 10.1016/S0896-6273(00)80403-1. - DOI - PubMed

Publication types