. 2017 Dec 27;139(51):18640-18646.
doi: 10.1021/jacs.7b10106. Epub 2017 Dec 13.

Real-Time Conformational Changes and Controlled Orientation of Native Proteins Inside a Protein Nanoreactor

Affiliations

Real-Time Conformational Changes and Controlled Orientation of Native Proteins Inside a Protein Nanoreactor

Veerle Van Meervelt et al. J Am Chem Soc. .

Abstract

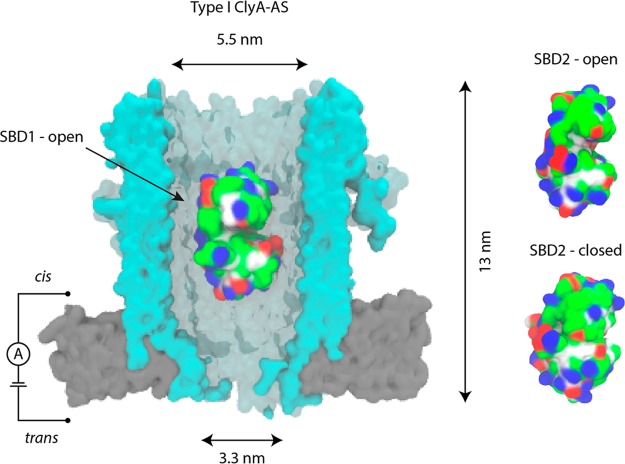
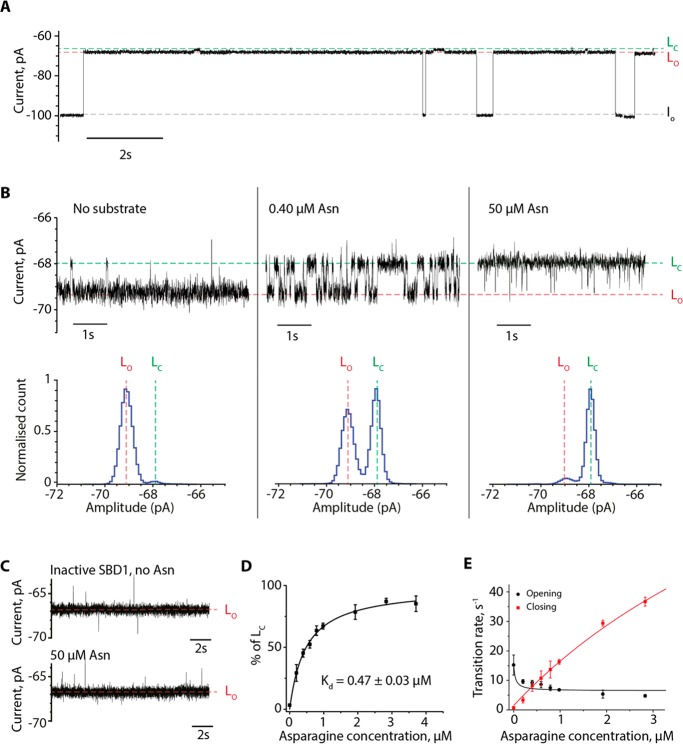
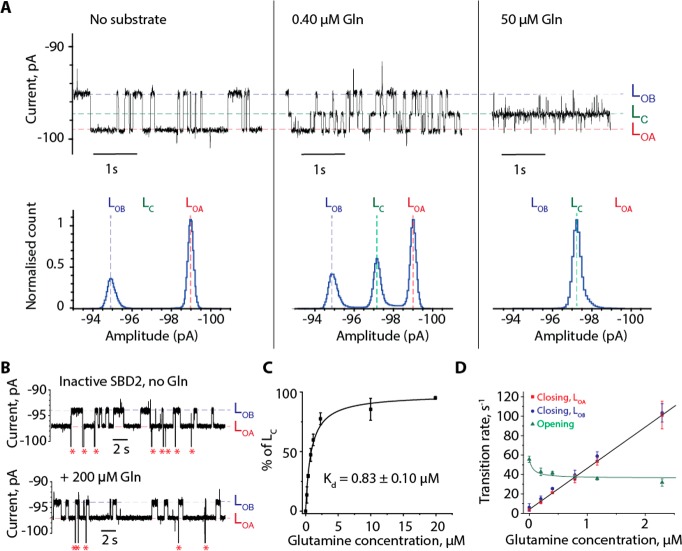
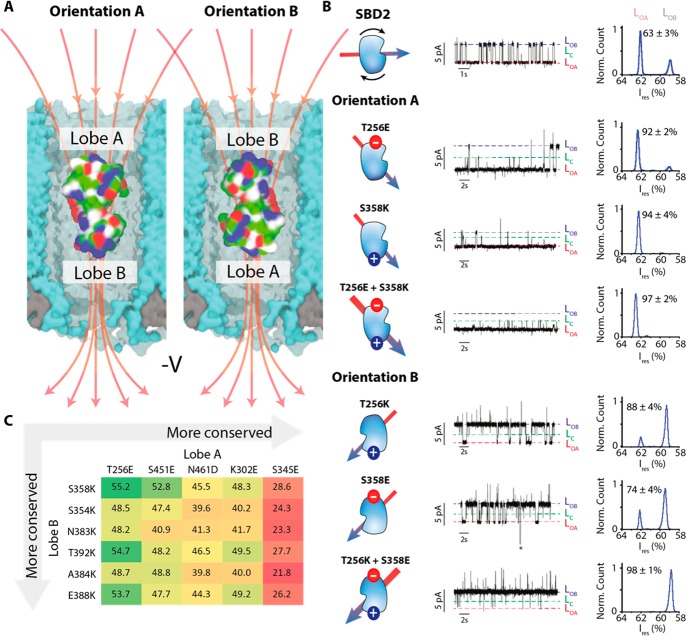
Protein conformations play crucial roles in most, if not all, biological processes. Here we show that the current carried through a nanopore by ions allows monitoring conformational changes of single and native substrate-binding domains (SBD) of an ATP-Binding Cassette importer in real-time. Comparison with single-molecule Förster Resonance Energy Transfer and ensemble measurements revealed that proteins trapped inside the nanopore have bulk-like properties. Two ligand-free and two ligand-bound conformations of SBD proteins were inferred and their kinetic constants were determined. Remarkably, internalized proteins aligned with the applied voltage bias, and their orientation could be controlled by the addition of a single charge to the protein surface. Nanopores can thus be used to immobilize proteins on a surface with a specific orientation, and will be employed as nanoreactors for single-molecule studies of native proteins. Moreover, nanopores with internal protein adaptors might find further practical applications in multianalyte sensing devices.


Conflict of interest statement

The authors declare no competing financial interest.

Figures

Figure 1
Figure 1
Trapping proteins inside the ClyA nanopore. (Left) Surface representation of Type I ClyA-AS (blue) in the bilayer (gray) with SBD1 (PDB-ID = 4KPT) in open conformation lodged inside the nanopore. (Right) SBD2 in open (PDB-ID = 4KR5) and closed (PDB-ID = 4KQP) conformation. SBDs are colored according to the residue type: basic residues are colored blue, acidic residues red, polar residues green, and nonpolar residues white. Created with VMD while ClyA was created by homology modeling using the E. coli ClyA crystal structure.,
Figure 2
Figure 2
Conformational dynamics of SBD1 inside ClyA-AS. (A) Typical ionic current blockades provoked by the capture of SBD1 (74 nM, cis) by the ClyA-AS nanopore at −60 mV. The open pore (IO) and SBD-blocked (L) current levels are indicated, with LO and LC corresponding to the open and closed state of SBD1. (B) Details of SBD1 current blockade before and after addition of 0.40 μM and 50 μM asparagine (added cis). (C) Typical current blockades of the inactive SBD1(E184W) variant before and after addition of 50 μM asparagine showing no ligand-induced current blockades. (D) The Kdapp value of SBD1 for asparagine was obtained from the areas of the histograms of the open (LO) and ligand-bound (LC) populations as [LC/(LC + LO)]. The Kdapp is the concentration of substrate at 50% signal saturation. (E) Dependency of the opening and closing rates of SBD1 on asparagine concentration. The data in E were fitted to eq S5C (opening rates) and S6C (closing rates) as described in the SI. Current traces were collected in 150 mM NaCl, 15 mM Tris-HCl, pH 7.5 at 24 °C by applying a Bessel low-pass filter with a 2 kHz cutoff and sampled at 10 kHz. A postacquisition Gaussian filter of 100 Hz was applied. Experiments were performed at −60 mV.
Figure 3
Figure 3
Orientation and dynamics of SBD2 measured by nanopore experiments. (A) Typical current blockade provoked by the capture of SBD2 (72 nM, cis) by the ClyA-AS nanopore. Left, apo-SBD2, middle current blockades after the addition of 0.40 μM of glutamine (cis); and right, blockades after adding 50 μM glutamine (cis). (B) Typical current blockades provoked by the capture of inactive SBD2(D417F) (70 nM) before and after the addition of 200 μM glutamine to the cis side. Red asterisks represent the restoration of the open pore current after SBD2(D417F) exited from the pore. (C) Kdapp value of SBD2 for glutamine obtained by fitting to a binding isotherm, using the relative closed population [LC/(LOA + LOB + LC)] at the indicated substrate concentrations. (D) Opening and closing rates of SBD2 versus the glutamine concentration. The data was fitted by eq S5C (opening rates) and S6C (closing rates) as described in the SI. Experiments were performed at −100 mV in 150 mM NaCl, 15 mM Tris-HCl, pH 7.5 at 24 °C by applying a Bessel low-pass filter with a 2 kHz cutoff and sampled at 10 kHz. A postacquisition Gaussian filter of 100 Hz was then applied.
Figure 4
Figure 4
Tuning the orientation of SBD2 in the ClyA nanopore. (A) SBD2 inside the ClyA nanopore showing two possible orientations. The red arrows indicate the electric field lines upon negative applied voltage. (B) Typical ionic current blockades provoked by the capture of SBD2 and its variants (∼70 nM, cis) by Type I ClyA-AS nanopore at −100 mV. The conformation of SBD2 is shown on the left of the current trace with the arrow indicating the dipole moment of the protein. The latter was calculated using the dipole watcher plugin of VMD. The LOA, LOB, and LC current levels are indicated. The histograms show the distribution of LOA and LOB. The additional current spikes observed for SBD2 T256K; S358E and T256K+S358E variants did not depend on the concentration of ligand, suggesting they do not represent an additional conformation of SBD2. The asterisk represents the restoration of the open pore current after SBD2 exited from the pore. (C) Table showing the amino acids in lobe A and lobe B that were considered for substitutions and selected after supercharging and MD simulations. The residues are arranged from the least to the most conserved as indicated by the gray arrows. The values indicate the distances in angstrom between the two respective residues.
Scheme 1
Scheme 1. Kinetic Schemes for the Binding of Ligands to SBD1 (A) and SBD2 (B)
C represents a closed state, O an open state, and L is the ligand. The kinetics rates are obtained as shown in the SI. 95% confidence intervals are shown in Tables S3 and S4 in the SI.

References

    1. Boehr D. D.; Nussinov R.; Wright P. E. Nat. Chem. Biol. 2009, 5 (11), 789.10.1038/nchembio.232. - DOI - PMC - PubMed
    1. Popovych N.; Sun S.; Ebright R. H.; Kalodimos C. G. Nat. Struct. Mol. Biol. 2006, 13 (9), 831.10.1038/nsmb1132. - DOI - PMC - PubMed
    1. Carroll M. J.; Mauldin R. V.; Gromova A. V.; Singleton S. F.; Collins E. J.; Lee A. L. Nat. Chem. Biol. 2012, 8 (3), 246.10.1038/nchembio.769. - DOI - PMC - PubMed
    1. Tzeng S.-R.; Kalodimos C. G. Nature 2009, 462 (7271), 368.10.1038/nature08560. - DOI - PubMed
    1. Toseland C. P. J. Chem. Biol. 2013, 6 (3), 85.10.1007/s12154-013-0094-5. - DOI - PMC - PubMed

Publication types