

Does elevated glucose metabolism correlate with higher cell density in Neurofibromatosis type 1 associated peripheral nerve sheath tumors?
- PMID: 29206885
- PMCID: PMC5716584
- DOI: 10.1371/journal.pone.0189093
Does elevated glucose metabolism correlate with higher cell density in Neurofibromatosis type 1 associated peripheral nerve sheath tumors?
Abstract
Purpose: To investigate whether elevated glucose metabolism in neurofibroma, determined by [F18]-FDG-PET, is correlated with cell density in MRI, as expressed through the apparent diffusion coefficient.
Materials and methods: Patients diagnosed with neurofibromatosis type 1 and peripheral nerve sheath tumors (PNST) were enrolled in this prospective, IRB-approved study. After a single [F18]-FDG injection, patients consecutively underwent [F18]-FDG-PET/CT and [F18]-FDG-PET/MRI on the same day. Maximum and mean standardized uptake values (SUVmax, SUVmean) on [F18]-FDG-PET/CT and [F18]-FDG-PET/MRI were compared, and correlated with minimum and mean apparent diffusion coefficients (ADCmean, ADCmin).
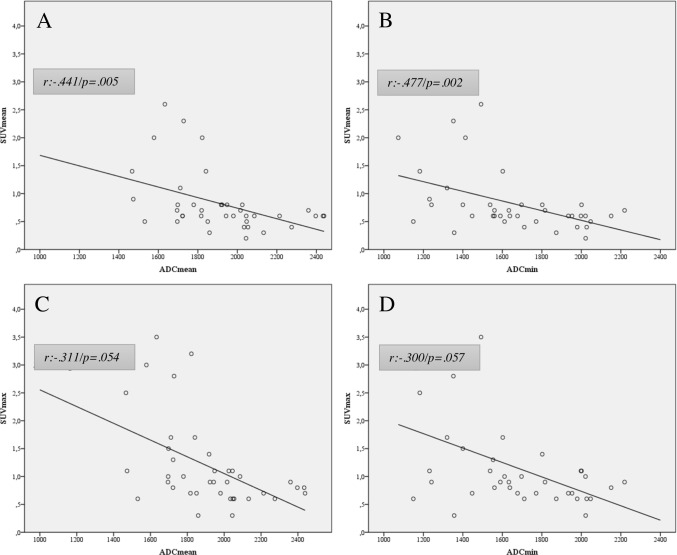
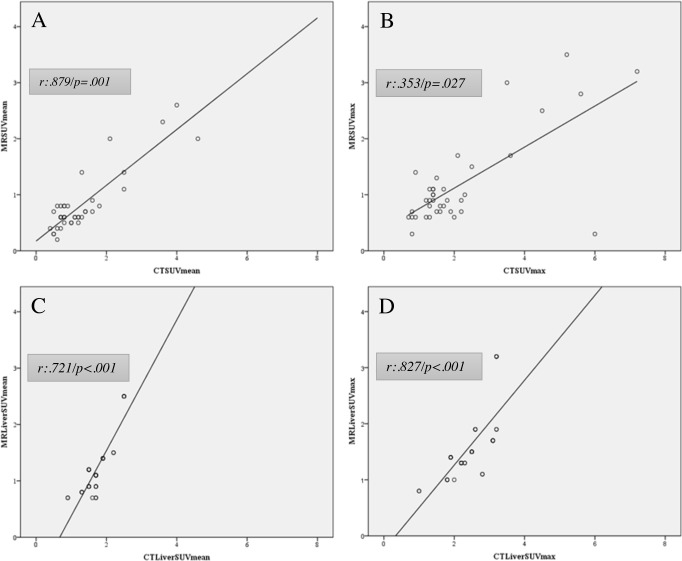
Results: A total of 12 (6 male/6 female, mean age was 16.2 ± 5.2 years) patients were prospectively included and analyzed on a per-lesion (n = 39) basis. The SUVmean of examined PNST showed a moderate negative correlation with the ADCmean (r = -.441) and ADCmin (r = -.477), which proved to be statistically significant (p = .005 and p = .002). The SUVmax of the respective lesions, however, showed a weaker negative correlation for ADCmean (r: -.311) and ADCmin (r: -.300) and did not reach statistical significance (p = .054 and p = .057). Lesion-based correlation between [F18]-FDG-PET/MRI and [F18]-FDG-PET/CT showed a moderate correlation for SUVmax (r = .353; p = .027) and a strong one for SUVmean (r = .879; p = .001)). Patient-based liver uptake (SUVmax and mean) of [F18]-FDG-PET/MRI and [F18]-FDG-PET/CT were strongly positively correlated (r = .827; p < .001 and r = .721; p < .001) but differed significantly (p < .001).
Conclusions: We found a statistically significant, negative correlation between glucose metabolism and cell density in PNST. Thus, ADCmean and ADCmin could possibly add complimentary information to the SUVmax and SUVmean and may serve as a potential determinant of malignant transformation of PNST.
Conflict of interest statement
Figures
Similar articles
-
Correlation between standardized uptake value and apparent diffusion coefficient of neoplastic lesions evaluated with whole-body simultaneous hybrid PET/MRI.AJR Am J Roentgenol. 2013 Nov;201(5):1115-9. doi: 10.2214/AJR.13.11304. AJR Am J Roentgenol. 2013. PMID: 24147485
-
Comprehensive anatomical and functional imaging in patients with type I neurofibromatosis using simultaneous FDG-PET/MRI.Eur J Nucl Med Mol Imaging. 2019 Mar;46(3):776-787. doi: 10.1007/s00259-018-4227-5. Epub 2018 Dec 8. Eur J Nucl Med Mol Imaging. 2019. PMID: 30535768
-
Comparative effectiveness of 18F-FDG PET/CT versus whole-body MRI for detection of malignant peripheral nerve sheath tumors in neurofibromatosis type 1.Clin Nucl Med. 2013 Jan;38(1):e19-25. doi: 10.1097/RLU.0b013e318266ce84. Clin Nucl Med. 2013. PMID: 23242059
-
Measurement of apparent diffusion coefficient with simultaneous MR/positron emission tomography in patients with peritoneal carcinomatosis: comparison with 18F-FDG-PET.J Magn Reson Imaging. 2014 Nov;40(5):1121-8. doi: 10.1002/jmri.24497. Epub 2013 Nov 8. J Magn Reson Imaging. 2014. PMID: 24923481
-
18F-Fluorodeoxyglucose Positron Emission Tomography/Magnetic Resonance in Lymphoma: Comparison With 18F-Fluorodeoxyglucose Positron Emission Tomography/Computed Tomography and With the Addition of Magnetic Resonance Diffusion-Weighted Imaging.Invest Radiol. 2016 Mar;51(3):163-9. doi: 10.1097/RLI.0000000000000218. Invest Radiol. 2016. PMID: 26784400 Free PMC article.
Cited by
-
Malignant Peripheral Nerve Sheath Tumors-A Comprehensive Review of Pathophysiology, Diagnosis, and Multidisciplinary Management.Children (Basel). 2022 Jan 1;9(1):38. doi: 10.3390/children9010038. Children (Basel). 2022. PMID: 35053663 Free PMC article. Review.
-
The Multimodality Management of Malignant Peripheral Nerve Sheath Tumours.Cancers (Basel). 2024 Sep 26;16(19):3266. doi: 10.3390/cancers16193266. Cancers (Basel). 2024. PMID: 39409887 Free PMC article. Review.
-
Coordinated medical care for children with neurofibromatosis type 1 and related RASopathies in Poland.Arch Med Sci. 2019 May 17;17(5):1221-1231. doi: 10.5114/aoms.2019.85143. eCollection 2021. Arch Med Sci. 2019. PMID: 34522251 Free PMC article.
References
-
- Yap YS, McPherson JR, Ong CK, Rozen SG, Teh BT, Lee AS et al. The NF1 gene revisited–from bench to bedside. Oncotarget. 2014;5: 5873–5892. doi: 10.18632/oncotarget.2194 - DOI - PMC - PubMed
-
- Uusitalo E, Rantanen M, Kallionpää RA, Pöyhönen M, Leppävirta J, Ylä-Outinen H, et al. Distinctive Cancer Associations in Patients With Neurofibromatosis Type 1. J Clin Oncol. 2016;34: 1978–1986. doi: 10.1200/JCO.2015.65.3576 - DOI - PubMed
-
- Tovmassian D, Abdul Razak M, London K. The Role of [18F]FDG-PET/CT in Predicting Malignant Transformation of Plexiform Neurofibromas in Neurofibromatosis-1. Int J Surg Oncol. 2016;2016: 6162182 doi: 10.1155/2016/6162182 - DOI - PMC - PubMed
-
- Pemov A, Li H, Patidar R, Hansen NF, Sindiri S, Hartley SW, Wei JS, et al. The primacy of NF1 loss as the driver of tumorigenesis in neurofibromatosis type 1-associated plexiform neurofibromas. Oncogene. 2017; 36: 3168–3177. doi: 10.1038/onc.2016.464 - DOI - PMC - PubMed
-
- Salamon J, Papp L, Tóth Z, Laqmani A, Apostolova I, Adam G, et al. Nerve Sheath Tumors in Neurofibromatosis Type 1: Assessment of Whole-Body Metabolic Tumor Burden Using F-18-FDG PET/CT. PLoS One. 2015;10; e0143305 doi: 10.1371/journal.pone.0143305 - DOI - PMC - PubMed
MeSH terms
LinkOut - more resources
Full Text Sources
Other Literature Sources
Research Materials
