

Monodisperse measurement of the biotin-streptavidin interaction strength in a well-defined pulling geometry
- PMID: 29206886
- PMCID: PMC5716544
- DOI: 10.1371/journal.pone.0188722
Monodisperse measurement of the biotin-streptavidin interaction strength in a well-defined pulling geometry
Abstract
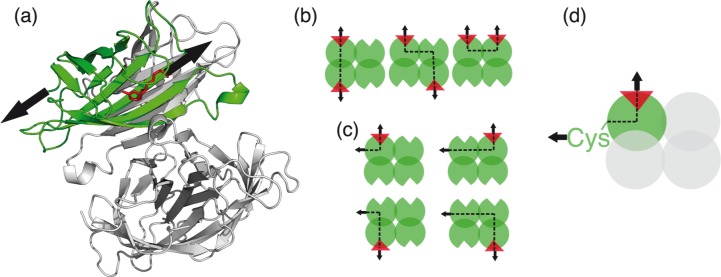
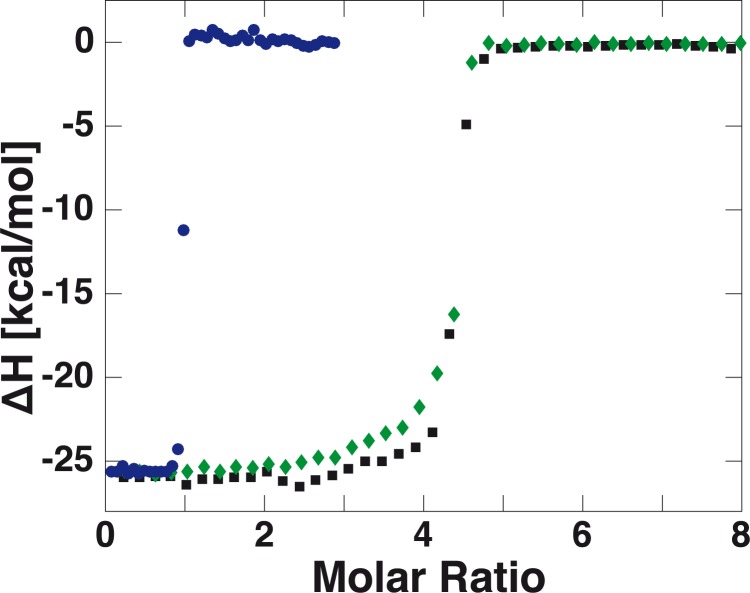
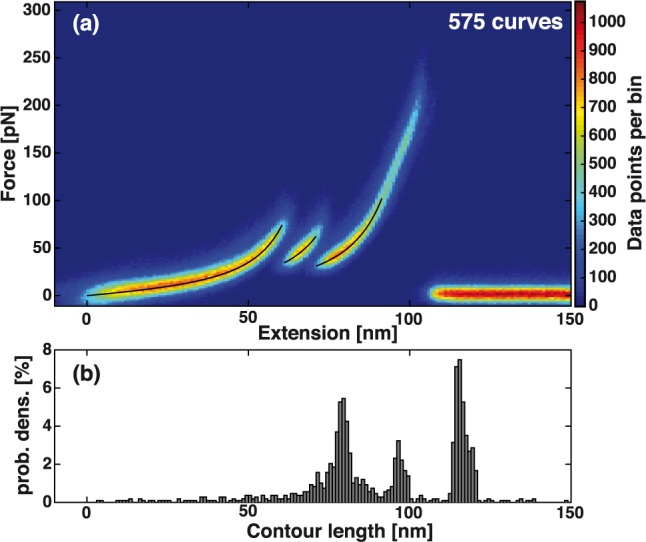
The widely used interaction of the homotetramer streptavidin with the small molecule biotin has been intensively studied by force spectroscopy and has become a model system for receptor ligand interaction. However, streptavidin's tetravalency results in diverse force propagation pathways through the different binding interfaces. This multiplicity gives rise to polydisperse force spectroscopy data. Here, we present an engineered monovalent streptavidin tetramer with a single cysteine in its functional subunit that allows for site-specific immobilization of the molecule, orthogonal to biotin binding. Functionality of streptavidin and its binding properties for biotin remain unaffected. We thus created a stable and reliable molecular anchor with a unique high-affinity binding site for biotinylated molecules or nanoparticles, which we expect to be useful for many single-molecule applications. To characterize the mechanical properties of the bond between biotin and our monovalent streptavidin, we performed force spectroscopy experiments using an atomic force microscope. We were able to conduct measurements at the single-molecule level with 1:1-stoichiometry and a well-defined geometry, in which force exclusively propagates through a single subunit of the streptavidin tetramer. For different force loading rates, we obtained narrow force distributions of the bond rupture forces ranging from 200 pN at 1,500 pN/s to 230 pN at 110,000 pN/s. The data are in very good agreement with the standard Bell-Evans model with a single potential barrier at Δx0 = 0.38 nm and a zero-force off-rate koff,0 in the 10-6 s-1 range.
Conflict of interest statement
Figures


Similar articles
-
Switchable reinforced streptavidin.Nanoscale. 2020 Mar 28;12(12):6803-6809. doi: 10.1039/d0nr00265h. Epub 2020 Mar 17. Nanoscale. 2020. PMID: 32181776
-
Dynamic force measurements of avidin-biotin and streptavdin-biotin interactions using AFM.Acta Biochim Pol. 2006;53(1):93-100. Epub 2006 Jan 12. Acta Biochim Pol. 2006. PMID: 16410837
-
Monovalent Strep-Tactin for strong and site-specific tethering in nanospectroscopy.Nat Nanotechnol. 2016 Jan;11(1):89-94. doi: 10.1038/nnano.2015.231. Epub 2015 Oct 12. Nat Nanotechnol. 2016. PMID: 26457965
-
Recent advances in the engineering and application of streptavidin-like molecules.Appl Microbiol Biotechnol. 2019 Sep;103(18):7355-7365. doi: 10.1007/s00253-019-10036-5. Epub 2019 Aug 1. Appl Microbiol Biotechnol. 2019. PMID: 31372706 Review.
-
Cupid and Psyche system for the diagnosis and treatment of advanced cancer.Proc Jpn Acad Ser B Phys Biol Sci. 2019;95(10):602-611. doi: 10.2183/pjab.95.041. Proc Jpn Acad Ser B Phys Biol Sci. 2019. PMID: 31827018 Free PMC article. Review.
Cited by
-
Direction Matters: Monovalent Streptavidin/Biotin Complex under Load.Nano Lett. 2019 Jun 12;19(6):3415-3421. doi: 10.1021/acs.nanolett.8b04045. Epub 2018 Oct 26. Nano Lett. 2019. PMID: 30346175 Free PMC article.
-
High-Yield Characterization of Single Molecule Interactions with DeepTipTM Atomic Force Microscopy Probes.Molecules. 2022 Dec 27;28(1):226. doi: 10.3390/molecules28010226. Molecules. 2022. PMID: 36615422 Free PMC article.
-
Removal of a Conserved Disulfide Bond Does Not Compromise Mechanical Stability of a VHH Antibody Complex.Nano Lett. 2019 Aug 14;19(8):5524-5529. doi: 10.1021/acs.nanolett.9b02062. Epub 2019 Jul 5. Nano Lett. 2019. PMID: 31257893 Free PMC article.
-
Single-Molecule Unbinding Forces between the Polysaccharide Hyaluronan and Its Binding Proteins.Biophys J. 2018 Jun 19;114(12):2910-2922. doi: 10.1016/j.bpj.2018.05.014. Biophys J. 2018. PMID: 29925027 Free PMC article.
-
Covalent Positioning of Single DNA Molecules for Nanopatterning.Nanomaterials (Basel). 2021 Jun 30;11(7):1725. doi: 10.3390/nano11071725. Nanomaterials (Basel). 2021. PMID: 34209077 Free PMC article.
References
-
- Green NM. Avidin and streptavidin. Methods Enzymol. 1990;184:51–67. . - PubMed
-
- Gonzalez M, Argarana CE, Fidelio GD. Extremely high thermal stability of streptavidin and avidin upon biotin binding. Biomol Eng. 1999;16(1–4):67–72. . - PubMed
-
- Bayer EA, Zalis MG, Wilchek M. 3-(N-Maleimido-propionyl)biocytin: a versatile thiol-specific biotinylating reagent. Anal Biochem. 1985;149(2):529–36. . - PubMed
-
- Howarth M, Takao K, Hayashi Y, Ting AY. Targeting quantum dots to surface proteins in living cells with biotin ligase. Proc Natl Acad Sci U S A. 2005;102(21):7583–8. doi: 10.1073/pnas.0503125102 ; PubMed Central PMCID: PMCPMC1129026. - DOI - PMC - PubMed
-
- Spate AK, Dold JE, Batroff E, Schart VF, Wieland DE, Baudendistel OR, et al. Exploring the Potential of Norbornene-Modified Mannosamine Derivatives for Metabolic Glycoengineering. Chembiochem. 2016;17(14):1374–83. doi: 10.1002/cbic.201600197 . - DOI - PubMed
MeSH terms
Substances
LinkOut - more resources
Full Text Sources
Other Literature Sources
