. 2017 Dec 1;186(11):1281-1289.
doi: 10.1093/aje/kwx184.

Potential for Bias When Estimating Critical Windows for Air Pollution in Children's Health

Affiliations

Potential for Bias When Estimating Critical Windows for Air Pollution in Children's Health

Ander Wilson et al. Am J Epidemiol. .

Abstract

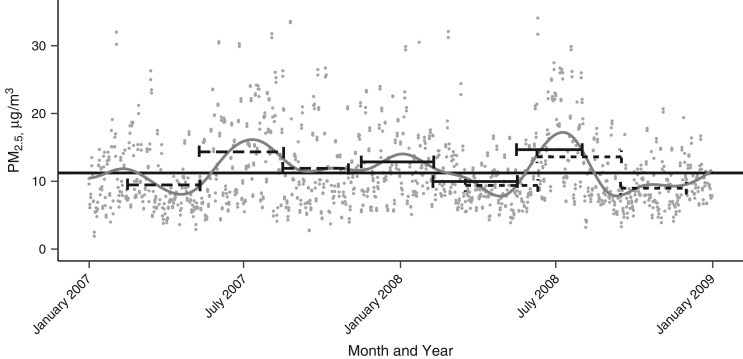
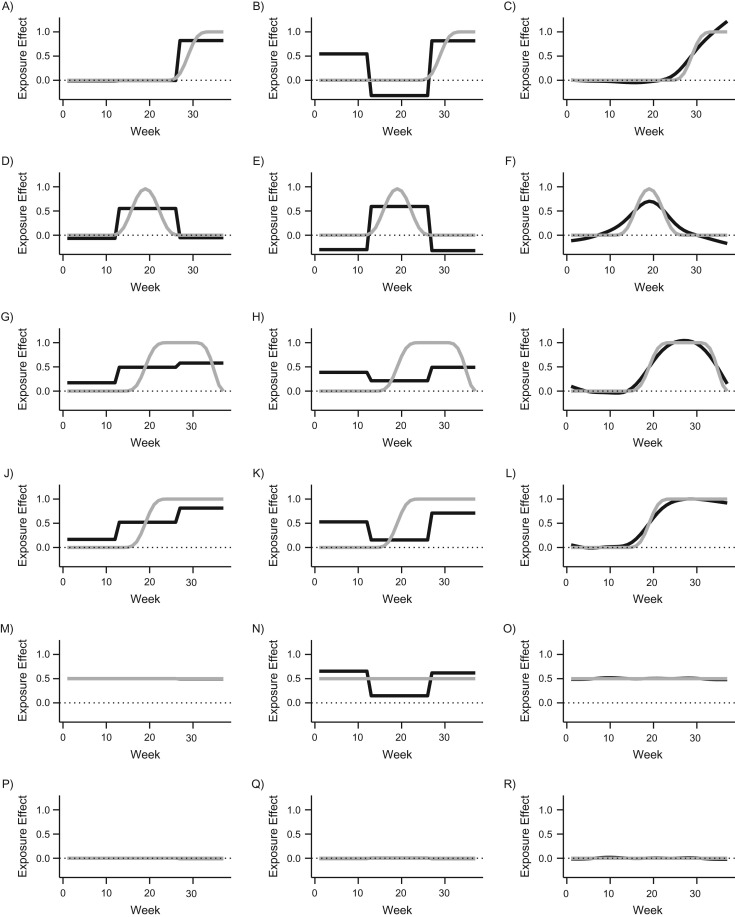
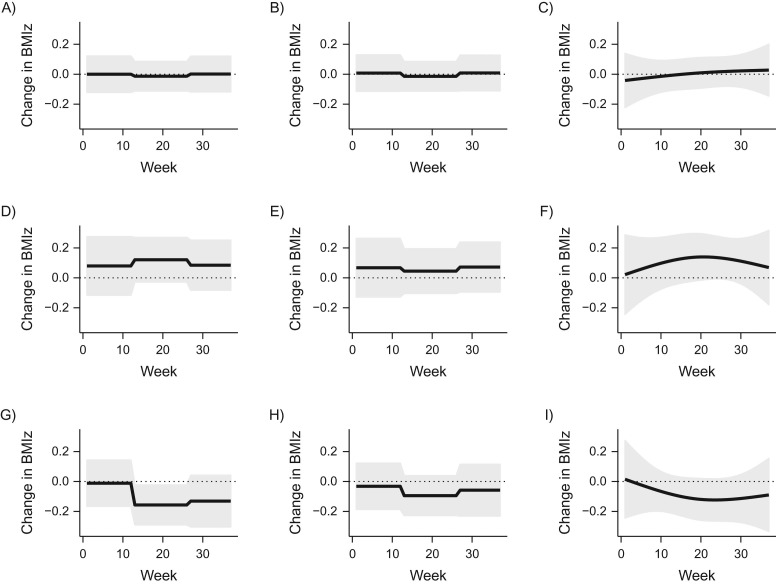
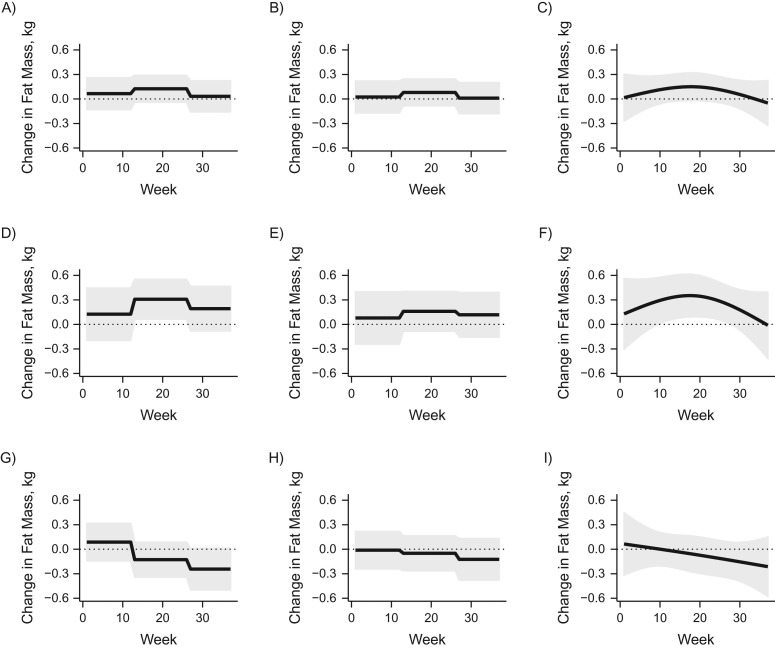
Evidence supports an association between maternal exposure to air pollution during pregnancy and children's health outcomes. Recent interest has focused on identifying critical windows of vulnerability. An analysis based on a distributed lag model (DLM) can yield estimates of a critical window that are different from those from an analysis that regresses the outcome on each of the 3 trimester-average exposures (TAEs). Using a simulation study, we assessed bias in estimates of critical windows obtained using 3 regression approaches: 1) 3 separate models to estimate the association with each of the 3 TAEs; 2) a single model to jointly estimate the association between the outcome and all 3 TAEs; and 3) a DLM. We used weekly fine-particulate-matter exposure data for 238 births in a birth cohort in and around Boston, Massachusetts, and a simulated outcome and time-varying exposure effect. Estimates using separate models for each TAE were biased and identified incorrect windows. This bias arose from seasonal trends in particulate matter that induced correlation between TAEs. Including all TAEs in a single model reduced bias. DLM produced unbiased estimates and added flexibility to identify windows. Analysis of body mass index z score and fat mass in the same cohort highlighted inconsistent estimates from the 3 methods.

Keywords: air pollution; children’s health; confounding bias; critical windows; distributed lag models; seasonality.


Figures

Figure 1.
Figure 1.
Illustration of how seasonal patterns in particulate matter having an aerodynamic diameter of ≤2.5 μm (PM2.5) result in the correlation between trimester average exposures (TAEs) in Suffolk County, Massachusetts, 2007 and 2009. The gray dots are PM2.5 values, and the gray line is the smoothed trend. The horizontal line segments illustrate the TAEs for hypothetical births (each line type—solid, long dash, and short dash—is a different birth). The horizontal line segments are vertically aligned to the TAE and each span 1 trimester.
Figure 2.
Figure 2.
Results from the simulation study comparing the joint trimester average exposure (TAE), separate TAE, and distributed lag model (DLM) approaches. A) Joint TAE and scenario 1; B) separate TAE and scenario 1; C) DLM and scenario 1; D) joint TAE and scenario 2; E) separate TAE and scenario 2; F) DLM and scenario 2; G) joint TAE and scenario 3; H) separate TAE and scenario 3; I) DLM and scenario 3; J) joint TAE and scenario 4; K) separate TAE and scenario 4; L) DLM and scenario 4; M) joint TAE and scenario 5; N) separate TAE and scenario 5; O) DLM and scenario 5; P) joint TAE and scenario 6; Q) separate TAE and scenario 6; and R) DLM and scenario 6. The estimated DLM functions were constructed with natural splines with the degrees of freedom selected with generalized cross-validation. The gray lines show the simulated true exposure effects for each week. The black lines are the mean estimated weekly exposure effects over 1,000 simulated data sets.
Figure 3.
Figure 3.
Results from the analysis of the association between particulate matter having an aerodynamic diameter of ≤2.5 μm (PM2.5) and body mass index z score (BMIz) in data from the Asthma Coalition on Community, Environment, and Social Stress in the area of Boston, Massachusetts, 2002–2009. The estimates are for all children (n = 238), boys only (n = 130), and girls only (n = 108), each using methods from among joint trimester average exposure (TAE), separate TAE, and distributed lag model (DLM). A) Joint TAE; B) separate TAE; C) DLM; D) joint TAE for boys; E) separate TAE for boys; F) DLM for boys; G) joint TAE for girls; H) separate TAE for girls; I) DLM for girls. For each estimate using DLM, there were 3 degrees of freedom. All estimates were adjusted for maternal race, maternal age, maternal prepregnancy body mass index, maternal educational level, and age of the child when BMIz was measured. The overall estimate was adjusted for child sex. The thick lines show the estimated values, and the gray ribbons show the 95% pointwise confidence intervals.
Figure 4.
Figure 4.
Results from the analysis of the association between fine particulate matter (PM2.5) and fat mass (kg) in data from the Asthma Coalition on Community, Environment, and Social Stress in the area of Boston, Massachusetts, 2002–2009. The estimates are for all children (n = 224), boys only (n = 130), and girls only (n = 94), each using methods from among joint trimester average exposure (TAE), separate TAE, and distributed lag model (DLM). A) Joint TAE; B) separate TAE; C) DLM; D) joint TAE for boys; E) separate TAE for boys; F) DLM for boys; G) joint TAE for girls; H) separate TAE for girls; I) DLM for girls. For each estimate using DLM, there were 3 degrees of freedom. All estimates were adjusted for maternal race, maternal age, maternal prepregnancy body mass index, maternal educational level, and age of the child when fat mass was measured. The overall estimate was adjusted for child sex. The thick lines show the estimated values, and the gray ribbons show the 95% pointwise confidence intervals.

References

    1. Edwards S, Maxson P, Sandberg N, et al. . Air pollution and pregnancy outcomes In: Nadadur SS, Hollingsworth JW, eds. Air Pollution and Health Effects. London, United Kingdom: Springer-Verlag; 2015:51–91.
    1. Stieb DM, Chen L, Eshoul M, et al. . Ambient air pollution, birth weight and preterm birth: a systematic review and meta-analysis. Environ Res. 2012;117:100–111. - PubMed
    1. Shah PS, Balkhair T. Air pollution and birth outcomes: a systematic review. Environ Int. 2011;37(2):498–516. - PubMed
    1. Srám RJ, Binková B, Dejmek J, et al. . Ambient air pollution and pregnancy outcomes: a review of the literature. Environ Health Perspect. 2005;113(4):375–382. - PMC - PubMed
    1. Allen JL, Oberdorster G, Morris-Schaffer K, et al. . Developmental neurotoxicity of inhaled ambient ultrafine particle air pollution: parallels with neuropathological and behavioral features of autism and other neurodevelopmental disorders. Neurotoxicology. 2017;59:140–154. - PMC - PubMed

Substances