

Collision induced unfolding of isolated proteins in the gas phase: past, present, and future
- PMID: 29207278
- PMCID: PMC5828980
- DOI: 10.1016/j.cbpa.2017.11.010
Collision induced unfolding of isolated proteins in the gas phase: past, present, and future
Abstract
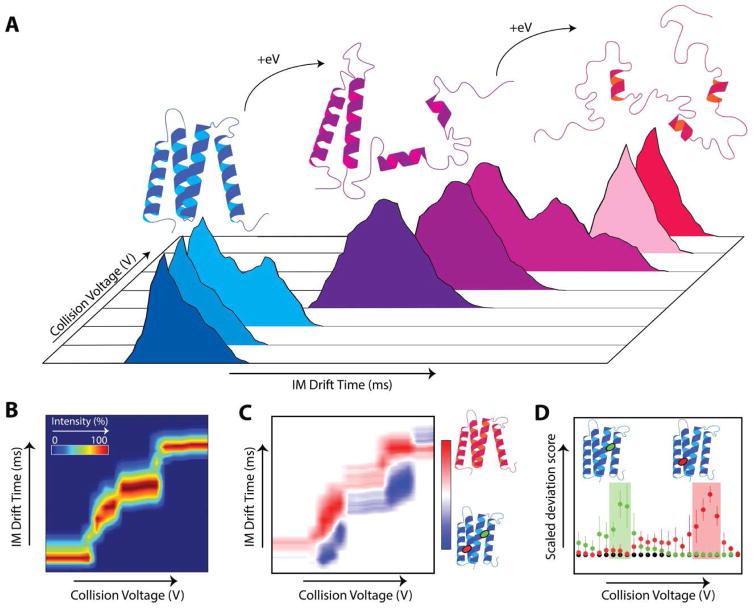
Rapidly characterizing the three-dimensional structures of proteins and the multimeric machines they form remains one of the great challenges facing modern biological and medical sciences. Ion mobility-mass spectrometry based techniques are playing an expanding role in characterizing these functional complexes, especially in drug discovery and development workflows. Despite this expansion, ion mobility-mass spectrometry faces many challenges, especially in the context of detecting small differences in protein tertiary structure that bear functional consequences. Collision induced unfolding is an ion mobility-mass spectrometry method that enables the rapid differentiation of subtly-different protein isoforms based on their unfolding patterns and stabilities. In this review, we summarize the modern implementation of such gas-phase unfolding experiments and provide an overview of recent developments in both methods and applications.
Copyright © 2017 Elsevier Ltd. All rights reserved.
Figures
 ligand and red shaded area for
 ligand.
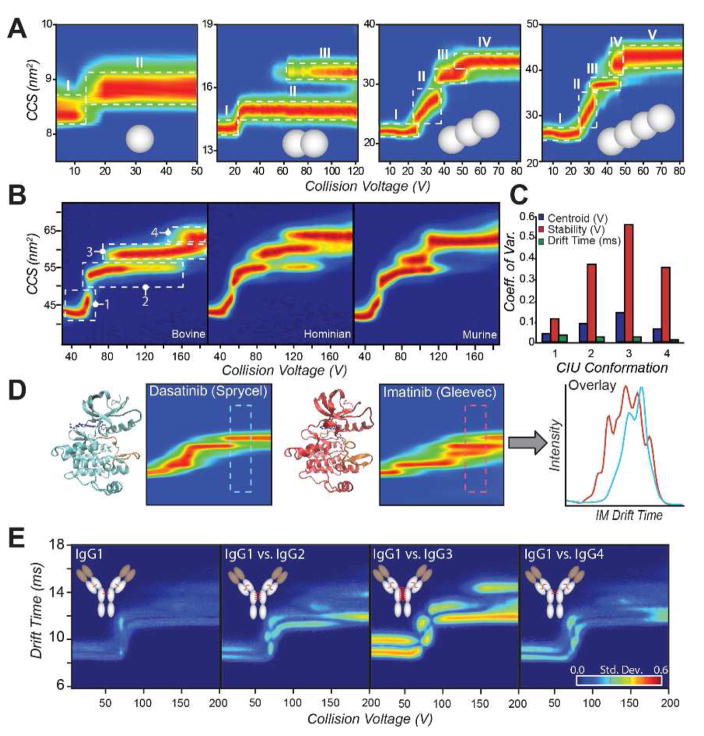
References
-
- Konermann L, Vahidi S, Sowole MA. Mass Spectrometry Methods for Studying Structure and Dynamics of Biological Macromolecules. Analytical Chemistry. 2014;86:213–232. - PubMed
-
- Lanucara F, Holman SW, Gray CJ, Eyers CE. The power of ion mobility-mass spectrometry for structural characterization and the study of conformational dynamics. Nat Chem. 2014;6:281–294. - PubMed
Publication types
MeSH terms
Substances
Grants and funding
LinkOut - more resources
Full Text Sources
Other Literature Sources
Miscellaneous
